 English
  Русский
 Bahasa Indonesia
 Bahasa Malay
 ไทย
ไทย Español
 Deutsch
 Български
 Français
 Tiếng Việt
 中文
中文 বাংলা
বাংলা हिन्दी
 Čeština
 Українська
 Română

Trade Analysis for Friday:
1H Chart of EUR/USD
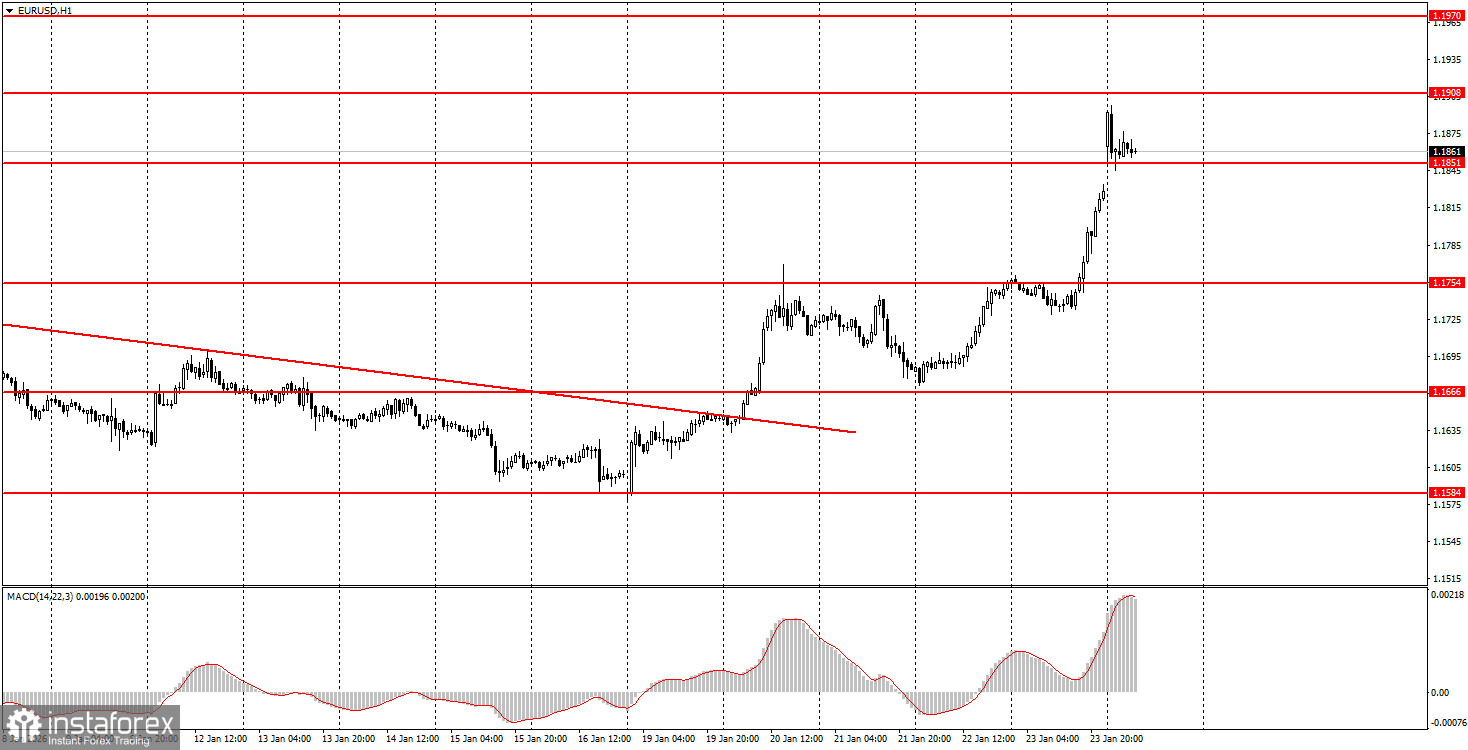
The EUR/USD currency pair continued its upward movement on Friday after breaking above the descending trendline. Let's recall that at the beginning of last week, the trend for the euro changed to upward, so expecting growth was a logical decision. The macroeconomic backdrop had virtually no impact on traders' sentiment on Friday, despite the large number of reports published. All morning reports can be confidently disregarded, as there was practically no movement in the market during the European trading session. In the second half of the day, the not-so-important U.S. business activity indices for the services and manufacturing sectors were published, along with the University of Michigan consumer sentiment index. The business activity indices nearly matched forecasts, while the consumer sentiment index exceeded expectations by a significant margin. Thus, a decline in the pair would have been even more justified. However, the fundamental backdrop continued to pull the dollar down throughout the past week and last year. The price finally consolidated above the 1.1800-1.1830 area, so the seven-month flat on the daily timeframe can be considered complete.
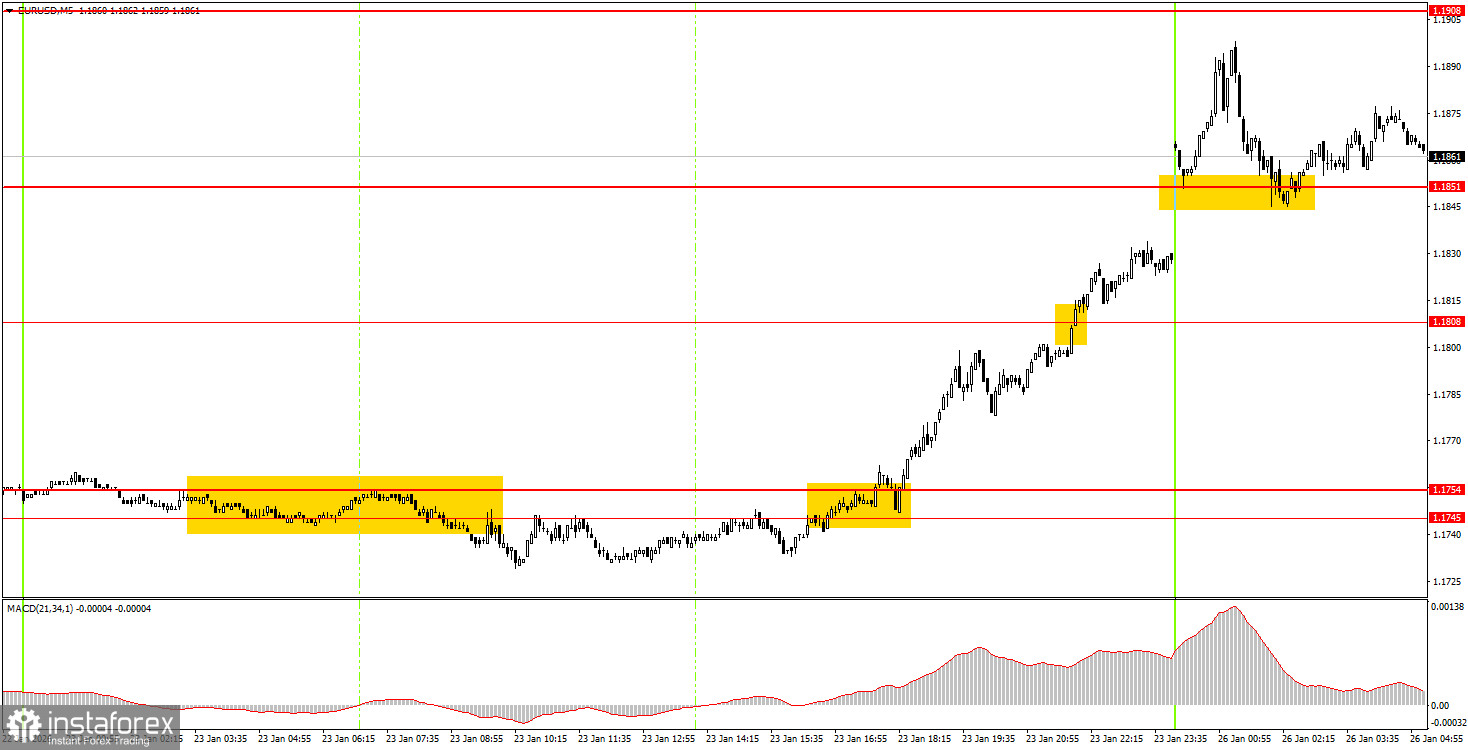
5M Chart of EUR/USD
How to Trade on Monday:
On the hourly timeframe, an upward trend is continuing to form. Last night, the price consolidated above the area of 1.1800-1.1830, above the area of 1.1400-1.1830, so the flat that lasted 7 months can be considered finished. The overall fundamental and macroeconomic background remains very weak for the U.S. dollar, so we fully support further growth of the European currency.
On Monday, beginner traders may open new long positions if there is a bounce from the 1.1851 level, with a target of 1.1908. A price consolidation below 1.1851 will allow opening shorts with targets at 1.1808 and 1.1745-1.1754.
On the 5-minute timeframe, the following levels should be considered: 1.1354-1.1363, 1.1413, 1.1455-1.1474, 1.1527-1.1531, 1.1550, 1.1584-1.1591, 1.1655-1.1666, 1.1745-1.1754, 1.1808, 1.1851, 1.1908, 1.1970-1.1988. Today, a secondary business climate index from Ifo will be published in Germany, while in the USA, a relatively important report on durable goods orders is expected. It is worth noting that the pair has broken out of its flat, and the fundamental backdrop may pull the dollar lower each day.
Main rules of the trading system:
- Signal strength is judged by the time required to form the signal (rebound or breakout). The less time required, the stronger the signal.
- If two or more trades were opened on false signals near a level, then all subsequent signals from that level should be ignored.
- In a flat, any pair can generate many false signals or none at all. In any case, at the first signs of a flat, it is better to stop trading.
- Trades are opened during the period between the start of the European session and the middle of the American session; after that, all trades must be closed manually.
- On the hourly timeframe, MACD-based signals should ideally be traded only when volatility is high, and a trend is confirmed by a trendline or trend channel.
- If two levels are located too close to each other (5–20 pips), they should be considered as a support or resistance area.
- After the price moves 15 pips in the correct direction, place a stop loss at breakeven.
What is shown on the charts:
Support and resistance price levels — levels that serve as targets when opening buys or sells. Take Profit can be placed near them.
Red lines — channels or trendlines that reflect the current tendency and show which direction is preferable to trade now.
MACD indicator (14,22,3) — histogram and signal line — an auxiliary indicator that can also be used as a source of signals.
Important speeches and reports (always listed in the news calendar) can strongly affect a currency pair's movement. Therefore, during their release, trading should be done with maximum caution, or positions should be closed, to avoid a sharp price reversal against the preceding move.
Beginner forex traders should remember that not every trade can be profitable. Developing a clear strategy and effective money management are the keys to long-term trading success.