 English
  Русский
 Bahasa Indonesia
 Bahasa Malay
 ไทย
ไทย Español
 Deutsch
 Български
 Français
 Tiếng Việt
 中文
中文 বাংলা
বাংলা हिन्दी
 Čeština
 Українська
 Română

Analysis of EUR/USD 5M
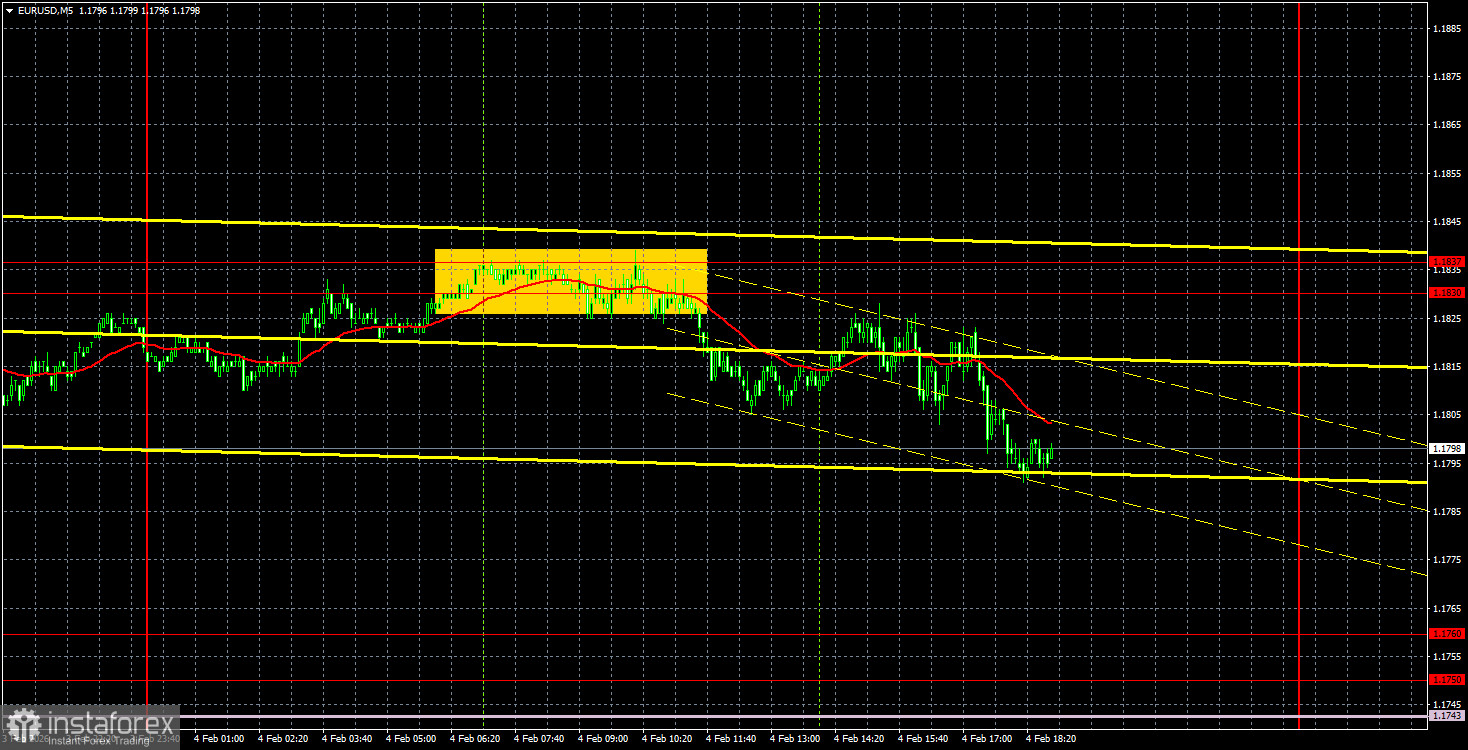
The EUR/USD currency pair traded very calmly in the first half of Wednesday and more actively in the second half. On the hourly timeframe, it is clear that the day's movements cannot be classified as a resumption of the downward trend or as a continuation of the correction. Price changes were minimal. Nevertheless, the European currency is currently below the Ichimoku indicator lines, indicating a local downward trend.
The technical situation is simple and clear, but the macroeconomic context is much more complex. We should start with the fact that yesterday's Eurozone inflation report could have triggered a significant drop in the euro. Despite the forecasts matching the actual figure (1.7%), this value is low enough for the ECB to begin considering easing monetary policy. Whether this is the case or not will be revealed today, but the report itself allowed the euro to drop. In the second half of the day, the market's reaction was more logical and adequate. The only published report this week, the ADP report on the US labor market, showed another dismal figure, falling short of even the minimum forecasts. Thus, in the second half of the day, the dollar had every reason to decline sharply. The ISM services activity index exceeded expectations, but not enough to have the market overlook the ADP report.
On the 5-minute timeframe, one trading signal was formed on Wednesday in the area of 1.1830-1.1837. During the European trading session, the price bounced from this area, and by the end of the day, it moved in the desired direction by about 15 pips. Not a significant gain, but the volatility yesterday was low.
COT Report
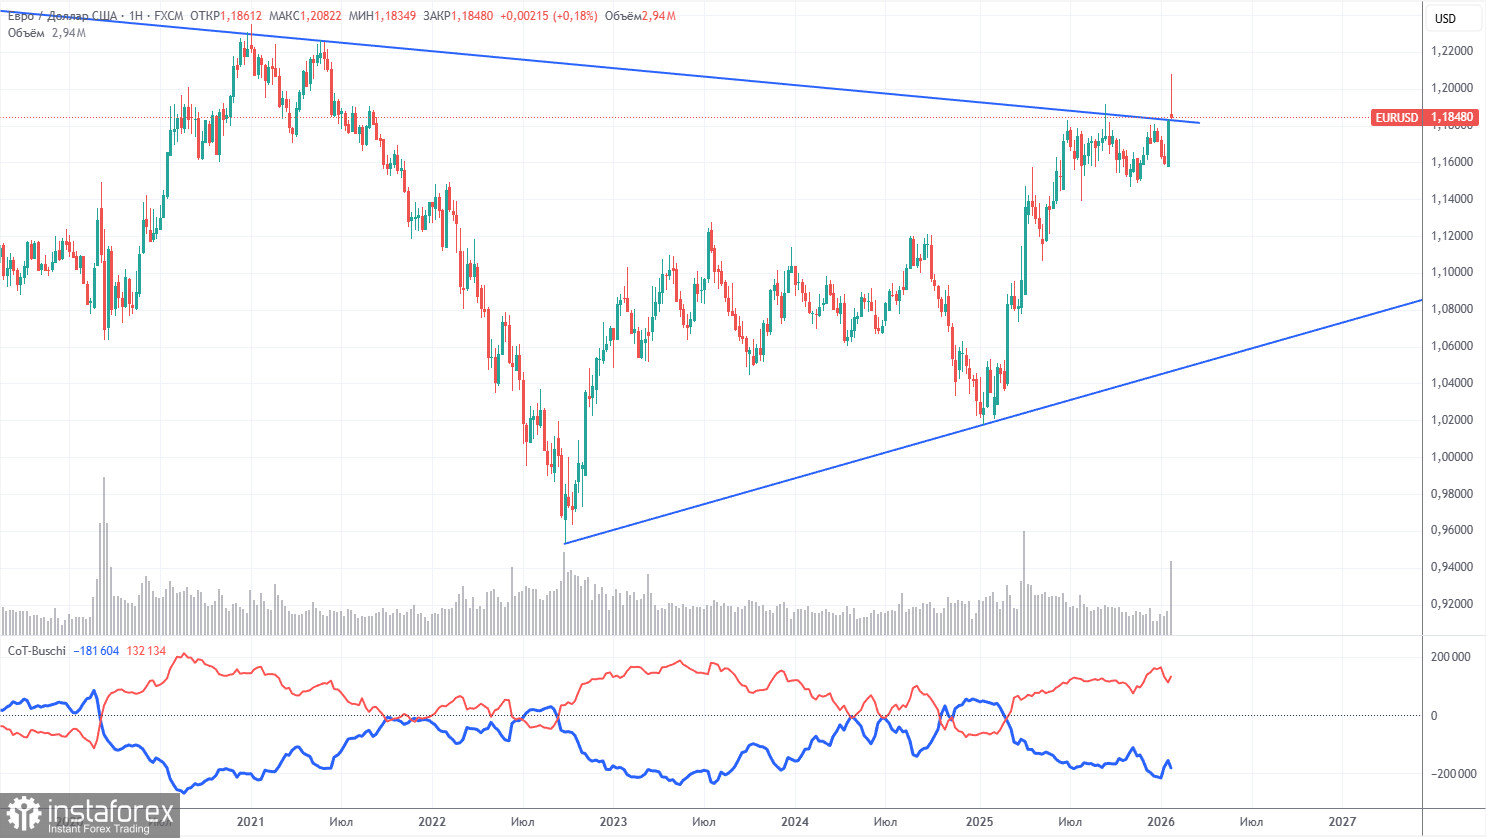
The latest COT report dated January 27 shows that the net position of non-commercial traders remains "bullish." Since Trump took office as president of the United States for the second time, the dollar has only been falling. We cannot say with 100% certainty that the decline of the American currency will continue, but current developments around the world hint at this possibility.
We still do not see any fundamental factors supporting the strengthening of the European currency, while there are sufficient factors for the weakening of the dollar. The global downward trend persists, but is it still relevant to consider where the price has moved over the last 18 years? A new upward trend has formed over the last three years, breaking through the global downward trend line. This trend line may be the cause of the downward pullback.
The positioning of the red and blue lines of the indicator continues to indicate the preservation of a "bullish" trend. Over the last reporting week, the number of long positions in the "Non-commercial" group increased by 15,100, while the number of short positions decreased by 5,300. Consequently, the net position increased by 20,400 contracts over the week.
Analysis of EUR/USD 1H
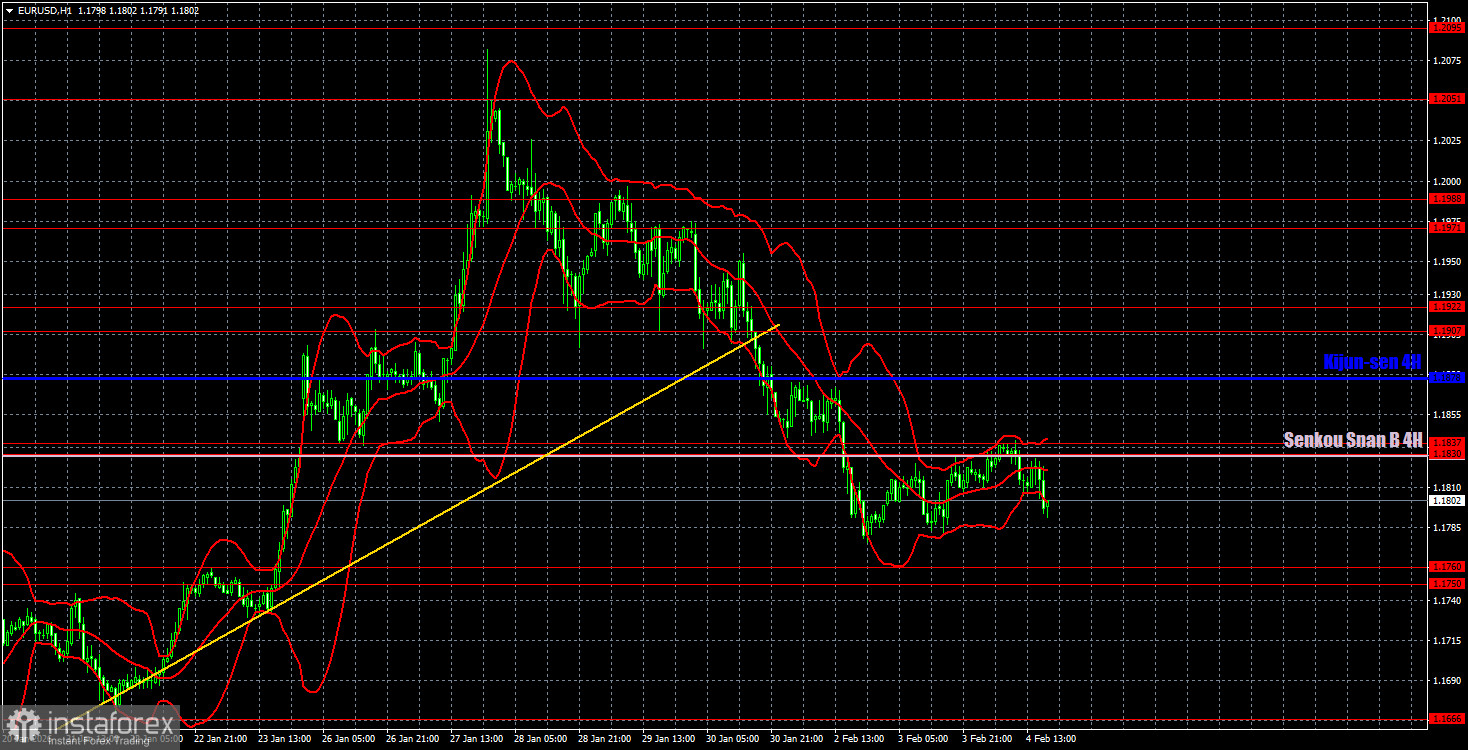
On the hourly timeframe, the EUR/USD pair continues to form an upward trend despite breaking the trendline and the ongoing correction. The pair has officially left the sideways channel of 1.1400-1.1830, in which it spent seven months. Therefore, we still expect growth in the European currency in 2026. The ECB and the Eurozone may resist this, but Donald Trump is expertly managing the dollar. Most of his decisions lead to its depreciation.
For February 5, we highlight the following important levels for trading: 1.1362, 1.1426, 1.1542, 1.1604-1.1615, 1.1657-1.1666, 1.1750-1.1760, 1.1830-1.1837, 1.1907-1.1922, 1.1971-1.1988, 1.2051, 1.2095, as well as the Senkou Span B line (1.1830) and Kijun-sen (1.1878). The Ichimoku indicator lines may shift throughout the day, which should be taken into account when determining trading signals. Remember to set the Stop Loss at breakeven if the price moves in the correct direction by 20 pips, which will safeguard against potential losses if the signal turns out to be false.
On Wednesday, the Eurozone is set to announce the results of the Bank of England's first meeting of the year. It is expected that the decision will be made to keep the key rate unchanged. The British pound may react only to unexpected results from the Monetary Policy Committee's voting on the rate.
Trading Recommendations:
Today, traders may consider short positions with a target of 1.3533-1.3548 if the price consolidates below the 1.3615-1.3633 range. Long positions will become relevant with a target of 1.3751-1.3763 if the price bounces from the Senkou Span B line.
Explanations for Illustrations:
- Price levels of support and resistance are thick red lines around which movement may end. They are not sources of trading signals.
- The Kijun-sen and Senkou Span B lines are Ichimoku indicator lines shifted to the hourly timeframe from the 4-hour timeframe. They serve as strong lines.
- Extreme levels are thin red lines from which the price has previously rebounded. They are sources of trading signals.
- Yellow lines represent trend lines, trend channels, and any other technical patterns.
- Indicator 1 on the COT charts shows the net position size of each trader category.