 English
  Русский
 Bahasa Indonesia
 Bahasa Malay
 ไทย
ไทย Español
 Deutsch
 Български
 Français
 Tiếng Việt
 中文
中文 বাংলা
বাংলা हिन्दी
 Čeština
 Українська
 Română

Analysis of GBP/USD 5M
The GBP/USD currency pair continued its near-collapse throughout Thursday. The British pound is in an obvious downward trend, which is now also supported by a trend line. Thus, from a technical perspective, everything is logical. From a fundamental perspective, this assertion can be disputed, but it is probably unnecessary. Yesterday, the Bank of England summarized the results of its first meeting in 2026, left the key rate unchanged, and the market, as we expected, reacted to the "dovish" voting results of the Monetary Policy Committee.
It turned out that four committee members voted in favor of a key rate cut, rather than two. This alone triggered the pound's collapse. However, we would also like to note that the British currency had been falling since the night and continued to fall during the European trading session. Therefore, the problem lies not only in the pseudo-"dovish" results of the British central bank's meeting.
Overall, we continue to believe that the British pound will appreciate in one way or another. It should just be understood that expectations of an upward trend do not mean that the pair will rise every day. Look at the daily timeframe—the upward trend leaves no doubt! However, corrections happen now and then, and sometimes they are completely unnecessary, hindering progress. Such is the market; there's nothing we can do about it. Traders are forced to adapt to it; nothing else is possible.
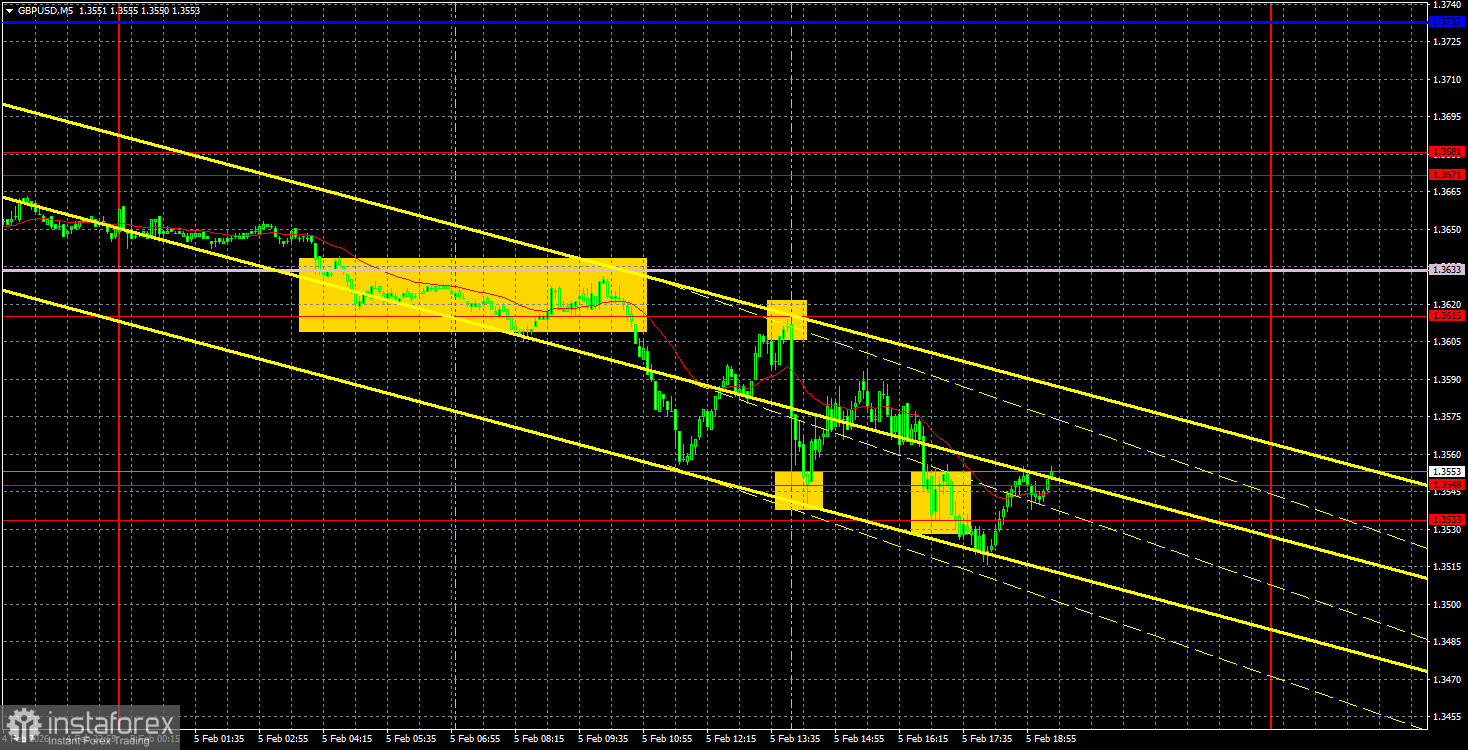
On the 5-minute timeframe, at least four trading signals were formed yesterday. During the European trading session, the pair bounced from the 1.3615-1.3633 area, then bounced from it again. Thus, traders had two opportunities to open shorts. In both cases, the price reached or nearly reached the target—the area of 1.3533-1.3548. The bounce and break through this area turned out to be false signals. However, in the first case, there could be no loss on the trade, since the price moved in the desired direction by more than 20 pips.
COT Report
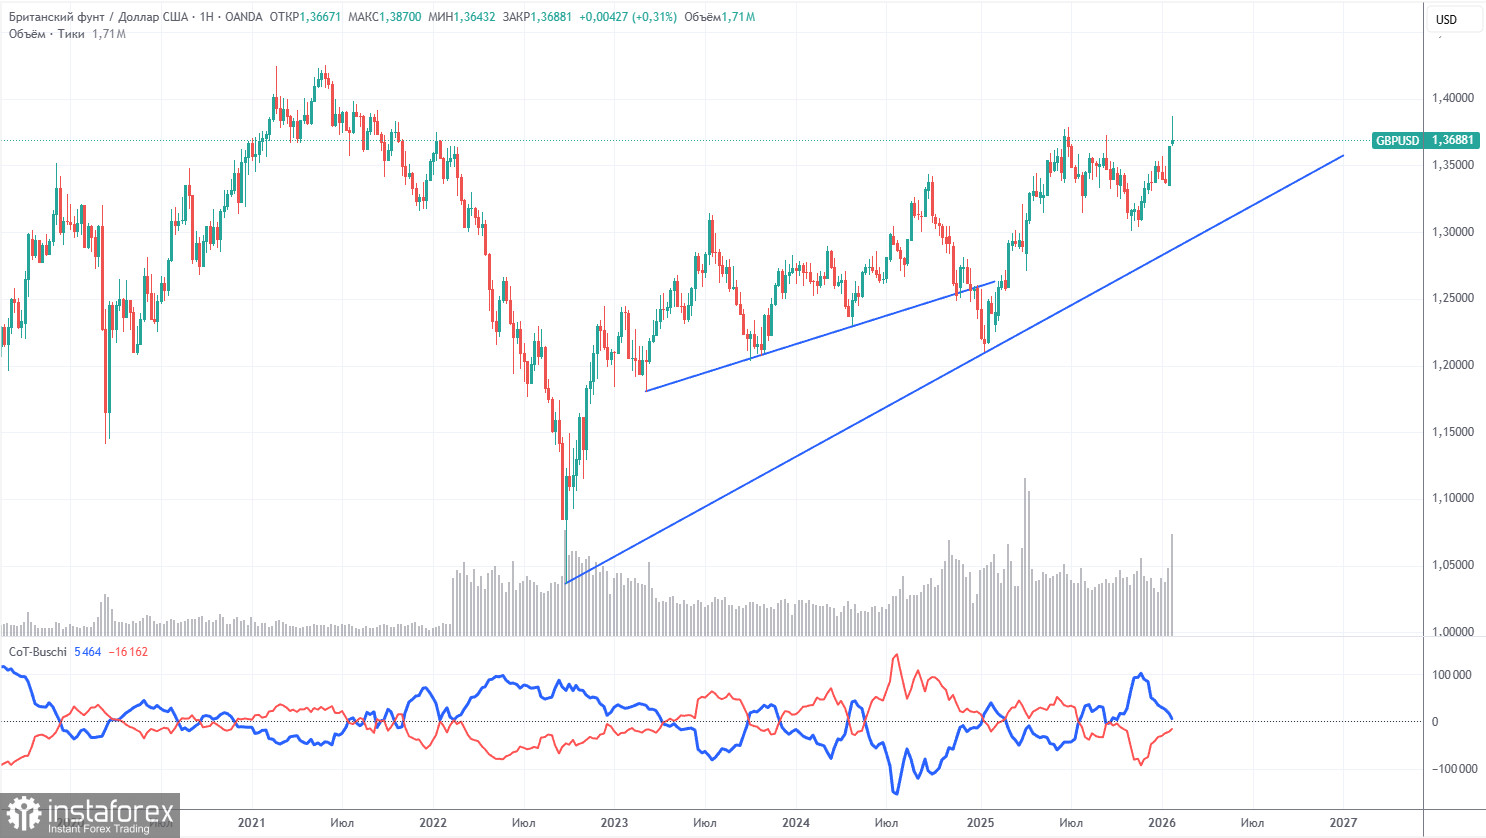
COT reports for the British pound show that commercial traders' sentiment has been changing steadily in recent years. The red and blue lines reflecting the net positions of commercial and non-commercial traders frequently cross and are generally close to the zero mark. Currently, the lines are approaching each other, and non-commercial traders still dominate with... sales. Recently, speculators have begun to build long positions, suggesting a shift in sentiment is possible soon, which should not particularly affect the GBP/USD pair.
The dollar continues to decline due to Donald Trump's policies, as shown on the weekly timeframe (illustration above). The trade war will continue in one form or another for a long time, and the Fed will, in any case, lower rates in the next 12 months. Demand for the dollar will fall in one way or another. According to the latest COT report (dated January 27) for the British pound, the "Non-commercial" group opened 6,500 BUY contracts and 600 SELL contracts. Thus, the net position of non-commercial traders increased by 5,900 contracts over the week.
In 2025, the pound rose significantly, but the reason is clear: Donald Trump's policy. Once this reason is mitigated, the dollar may begin to appreciate. But when this will happen is anyone's guess.
Analysis of GBP/USD 1H
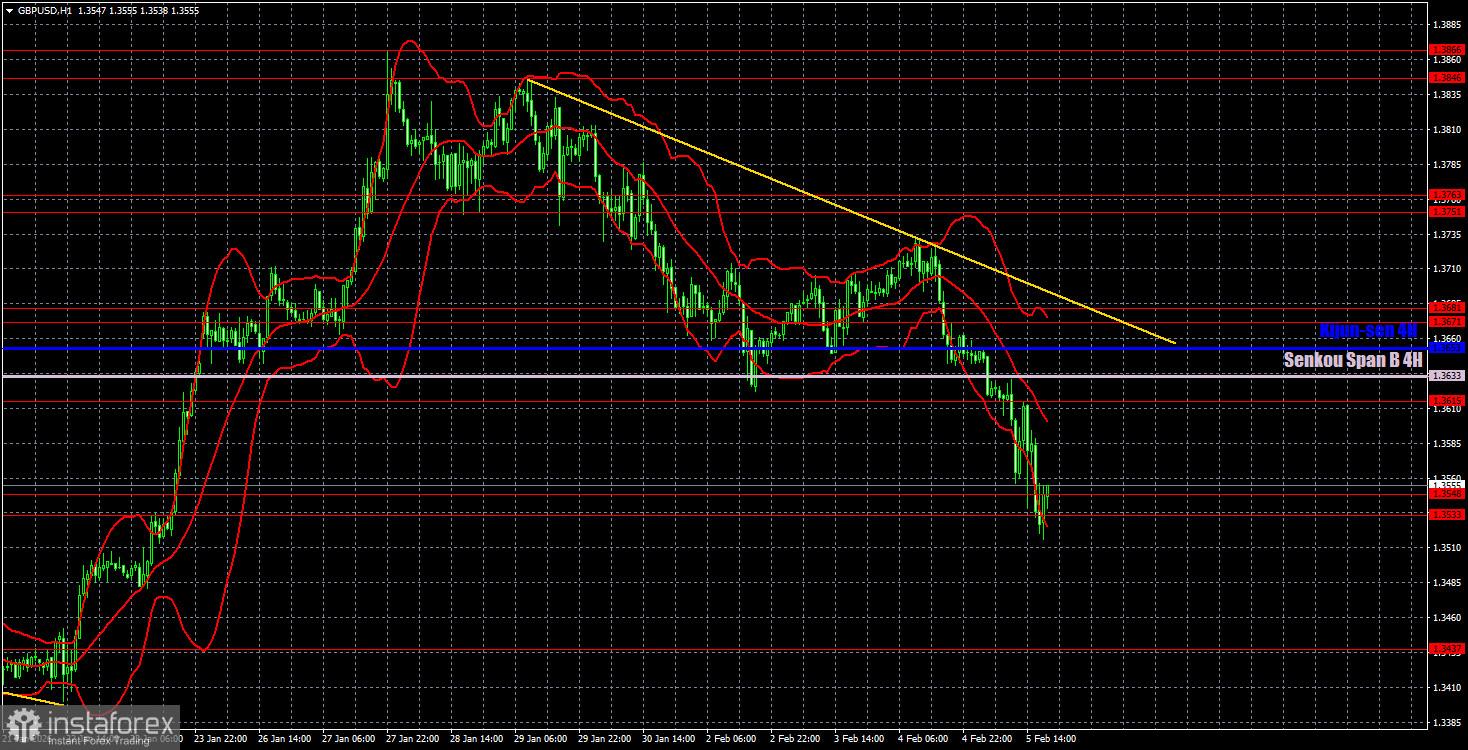
On the hourly timeframe, the GBP/USD pair has indeed transitioned to forming a full-fledged downward trend, aided by the Bank of England. The break of the Ichimoku indicator lines confirmed the market's intentions to sell the pound in the near future. Now, to reverse the trend back to an upward one, consolidation above the trend line and above the Senkou Span B line is required.
For February 6, we highlight the following important levels: 1.3201-1.3212, 1.3307, 1.3369-1.3377, 1.3437, 1.3533-1.3548, 1.3615, 1.3671-1.3681, 1.3751-1.3763, 1.3846-1.3886, 1.3948. The Senkou Span B line (1.3633) and the Kijun-sen line (1.3653) may also serve as signals. It is recommended to set the Stop Loss level to breakeven if the price moves in the correct direction by 20 pips. The Ichimoku indicator lines may move during the day, which should be taken into account when determining trading signals.
On Friday, no major events are scheduled in the UK, while in the U.S., only the University of Michigan consumer sentiment index will be published. Today, volatility may be much lower, and the pound may correct.
Trading Recommendations:
Today, traders may consider short positions targeting 1.3437 if the price consolidates below the area of 1.3533-1.3548. Long positions will become relevant targeting 1.3615 if the price bounces from the area of 1.3533-1.3548.
Explanations for Illustrations:
- Price levels of support and resistance are thick red lines around which movement may end. They are not sources of trading signals.
- The Kijun-sen and Senkou Span B lines are Ichimoku indicator lines shifted to the hourly timeframe from the 4-hour timeframe. They serve as strong lines.
- Extreme levels are thin red lines from which the price has previously rebounded. They are sources of trading signals.
- Yellow lines represent trend lines, trend channels, and any other technical patterns.
- Indicator 1 on the COT charts shows the net position size of each trader category.