 English
  Русский
 Bahasa Indonesia
 Bahasa Malay
 ไทย
ไทย Español
 Deutsch
 Български
 Français
 Tiếng Việt
 中文
中文 বাংলা
বাংলা हिन्दी
 Čeština
 Українська
 Română

Analysis of Tuesday's Trades:
1H Chart of the EUR/USD Pair
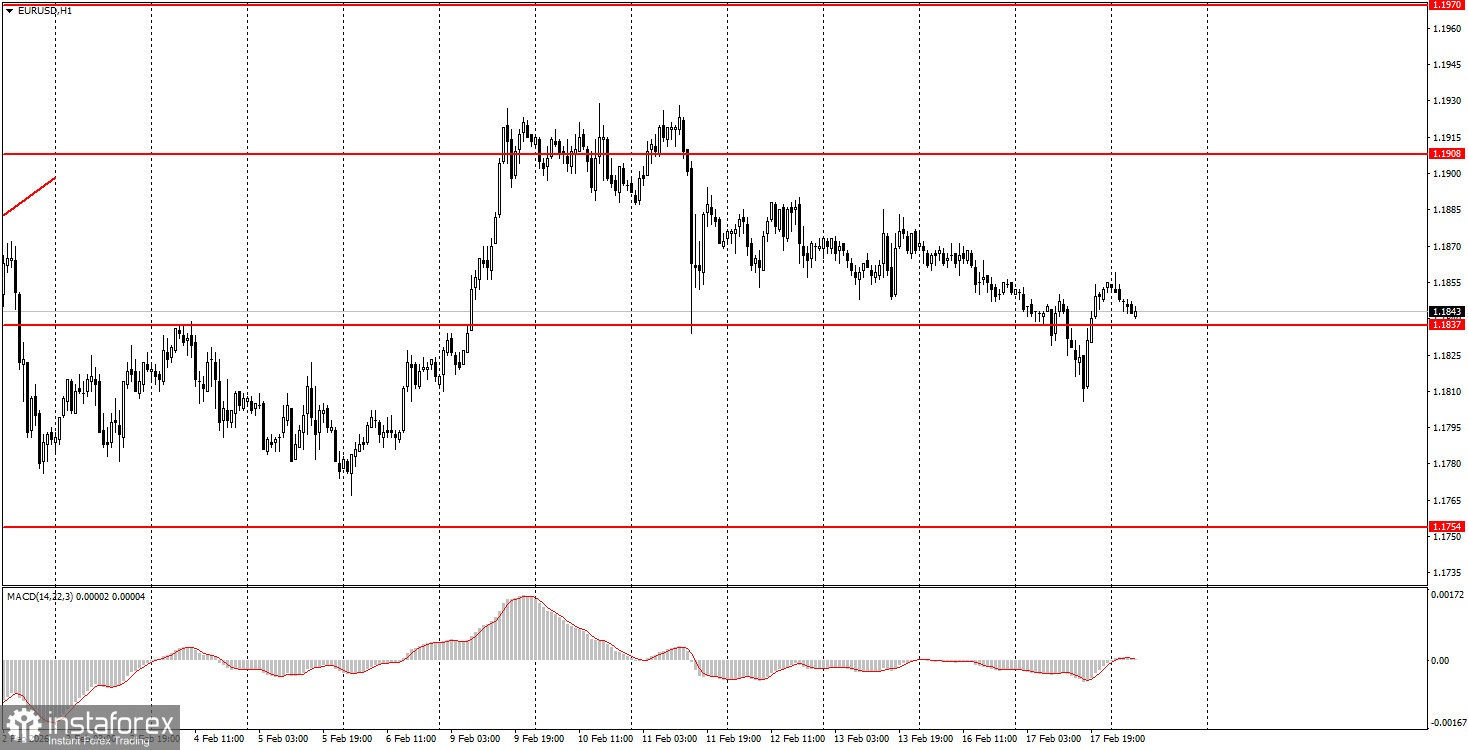
The EUR/USD currency pair traded lower for most of the day on Tuesday, but it recovered slightly near the end of the day. The euro has been falling for an entire week, and the new cycle of decline began after the publication of U.S. Non-Farm Payroll and unemployment data last week. Recall that these reports were unusually contradictory, as January's figures pleased traders and boosted the dollar, while the downward revision of the number of jobs created in 2025 by 400,000 can hardly be considered a positive factor for the dollar. Similarly, a decrease in inflation by the end of January opens up new "dovish" prospects for the Federal Reserve. Thus, in our view, the current decline of the pair and the rise of the dollar are unwarranted. Yesterday, the only macroeconomic events to note were secondary inflation reports from Germany, the ZEW economic sentiment indices, and the U.S. weekly ADP report. They had little influence on the pair's movement or trader sentiment.
5M Chart of the EUR/USD Pair
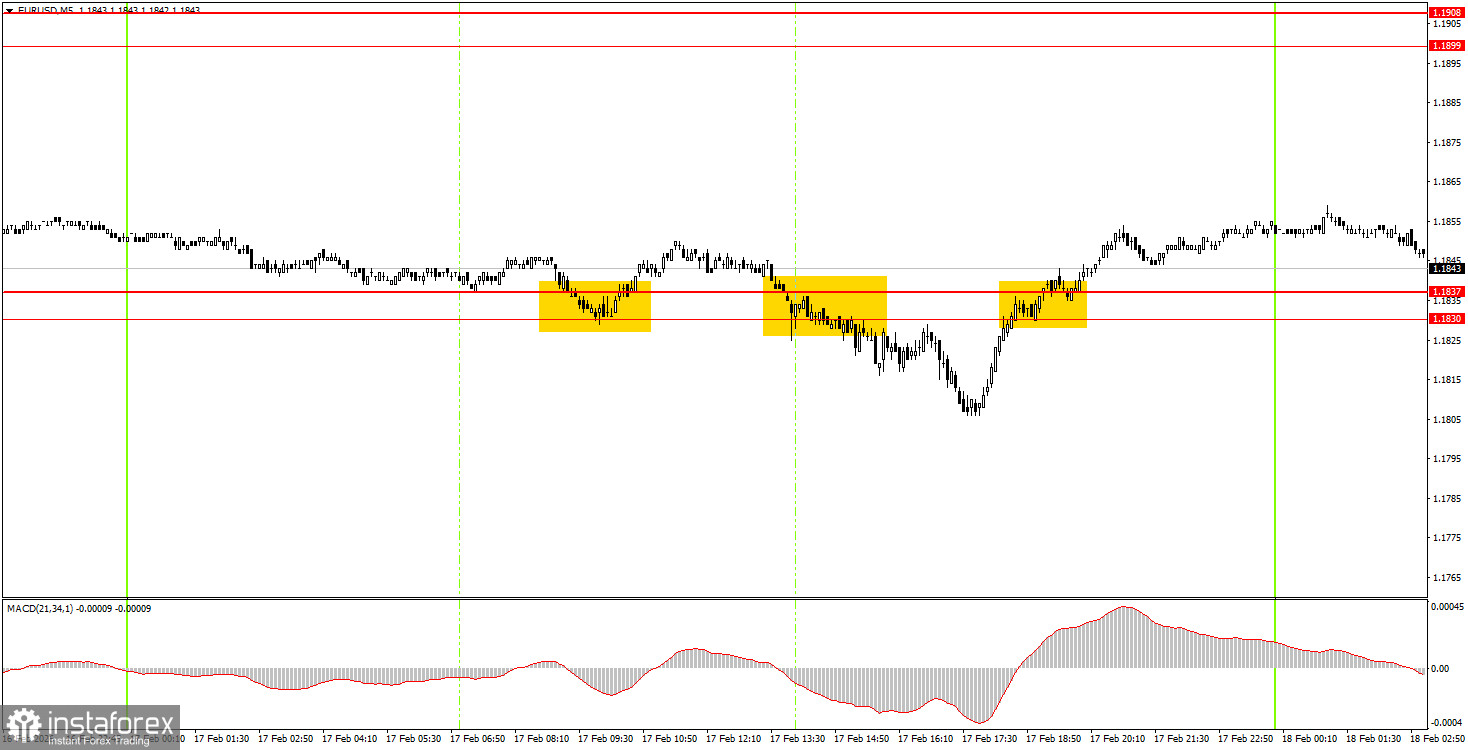
On the 5-minute timeframe, three weak trading signals were formed on Tuesday. The price initially bounced within the 1.1830-1.1837 range, then broke through it in both directions twice. The first trade resulted in a loss, as the price didn't move in the desired direction by even 15 pips. The second trade closed at a breakeven Stop Loss. The third trade can be held into Wednesday, as the pair remains within the 1.1830-1.1837 range.
How to Trade on Wednesday:
On the hourly timeframe, the downward correction continues, which may soon transform into an upward trend. Let's remind ourselves that the flat, which lasted for 7 months, has ended. If this is the case, the long-term upward trend has resumed at the beginning of 2026. Therefore, we expect a new medium-term decline in the dollar. The overall fundamental backdrop remains very challenging for the American currency, so we fully support further upward movement. Currently, the market is in another pause.
On Wednesday, beginner traders may consider short positions if the price consolidates below the 1.1830-1.1837 range, targeting the 1.1745-1.1754 area. A bounce from the range of 1.1830-1.1837 will allow for new long positions with a target of 1.1899-1.1908.
On the 5-minute timeframe, levels to consider include 1.1455-1.1474, 1.1527-1.1531, 1.1550, 1.1584-1.1591, 1.1655-1.1666, 1.1745-1.1754, 1.1830-1.1837, 1.1899-1.1908, 1.1970-1.1988, 1.2044-1.2056, 1.2092-1.2104.
Today in the Eurozone, there are no important reports or events scheduled, while in the U.S., reports on durable goods orders, building permits, and new housing starts will be released as a single batch.
Main Rules of the Trading System:
- The strength of the signal is determined by the time it takes to form (rebound or breaking through the level). The shorter the time, the stronger the signal.
- If two or more trades were opened around a particular level based on false signals, all subsequent signals from that level should be ignored.
- In a flat market, any pair can generate numerous false signals or no signals at all. In any case, it is best to stop trading at the first signs of a flat.
- Trades are opened during the time period between the start of the European session and until the middle of the American session, after which all trades should be manually closed.
- On the hourly timeframe, signals from the MACD indicator should ideally be traded only when there is good volatility and a trend confirmed by a trend line or channel.
- If two levels are too close to each other (ranging from 5 to 20 pips), they should be considered as a support or resistance area.
- After moving 15 pips in the correct direction, it is advisable to set the Stop Loss to break-even.
What's on the Charts:
- Support and resistance levels are targets for opening buy or sell trades. Take Profit levels can be placed around them.
- Red lines indicate channels or trend lines that reflect the current trend and indicate the preferred direction for trading now.
- The MACD indicator (14,22,3) – the histogram and signal line – serves as a supplementary indicator that can also be used as a source of signals.
- Important speeches and reports (always found in the news calendar) can significantly influence the movement of the currency pair. Therefore, during their release, trading should be conducted with maximum caution, or it is advised to exit the market to avoid a sharp price reversal against the preceding movement.
- Beginners trading in the Forex market should remember that not every trade can be profitable. Developing a clear strategy and practicing sound money management are the keys to long-term trading success.