 English
  Русский
 Bahasa Indonesia
 Bahasa Malay
 ไทย
ไทย Español
 Deutsch
 Български
 Français
 Tiếng Việt
 中文
中文 বাংলা
বাংলা हिन्दी
 Čeština
 Українська
 Română

Bitcoin and Ethereum continue to trade within established channels, with no major moves. There are occasional spikes in activity around the openings of European and US markets, but overall, the picture remains rather gloomy.

Meanwhile, according to the latest CryptoQuant data, capital is beginning to flow back into Bitcoin amid a sharp slowdown in altcoin activity. Since October 2025, altcoin trading volumes have shrunk by an impressive 50%. This rotation — where investors reallocate attention and funds from smaller cryptocurrencies back into the flagship digital asset — is a significant indicator for the crypto market.
The fact that we are seeing patterns similar to those that repeatedly appeared in previous corrective phases — and that typically preceded the end of bear markets — is particularly interesting. Historical analysis shows that similar capital rotations into Bitcoin occurred at key cycle moments, notably in April 2025, August 2024 and even October 2022, historically coinciding with consolidation periods and subsequent recoveries for Bitcoin.
This shift in investor focus may signal a broader change in market sentiment. In times of heightened uncertainty or when a correction approaches a bottom, most market participants tend to prefer more reliable and liquid assets — and Bitcoin is clearly in that category. Bitcoin's market dominance usually rises during such phases because it is seen as a safer haven compared with more volatile altcoins. The 50% drop in altcoin trading volumes confirms this thesis, suggesting that the number of traders betting on an altcoin season has halved and that bullish potential in many altcoins is exhausted — smart money is looking for new entry points or to strengthen positions in BTC.
Trading recommendations
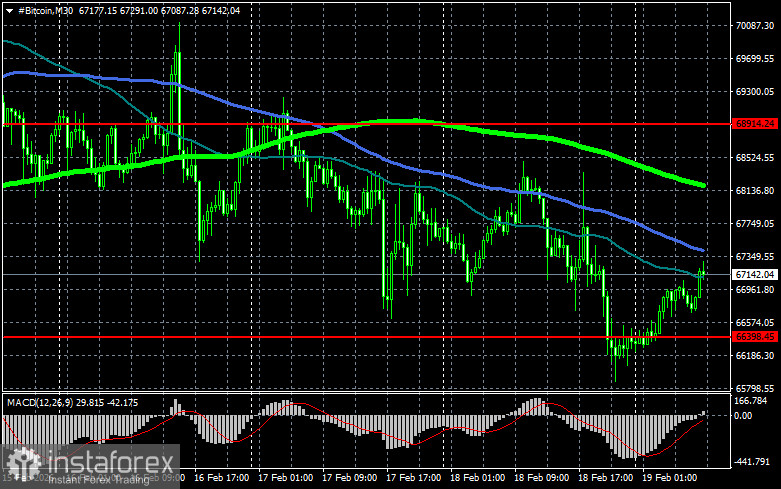
Bitcoin
Buyers are currently targeting a return to $68,900, which would open a direct path to $70,600 and then to $71,125. The further target is around $74,600; a break above that would indicate attempts to restore the bull market. In case of a decline, buyers are expected at $66,400. A move back below that area could quickly push BTC toward $64,400. The far downside target is $62,600.
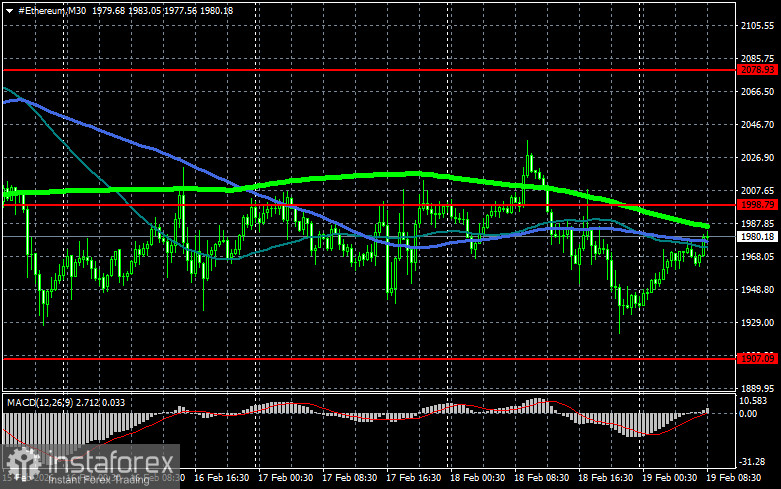
Ethereum
A clear hold above $1,998 opens a direct path to $2,078. The further target is around $2,169. If surpassed, that would indicate strengthening bullish sentiment and renewed buyer interest. In case of a decline, buyers are expected at $1,907. A move below that area could quickly push ETH toward $1,819. The far downside target is $1,724.
What's on the chart
- The red lines represent support and resistance levels, where price is expected to either pause or react sharply.
- The green line shows the 50-day moving average.
- The blue line is the 100-day moving average.
- The lime line is the 200-day moving average.
Price testing or crossing any of these moving averages often either halts movement or injects fresh momentum into the market.