 English
  Русский
 Bahasa Indonesia
 Bahasa Malay
 ไทย
ไทย Español
 Deutsch
 Български
 Français
 Tiếng Việt
 中文
中文 বাংলা
বাংলা हिन्दी
 Čeština
 Українська
 Română

GBP/USD
Analysis:
The unfinished wave structure on the major British pound chart can be considered a bearish wave that began on January 27 of this year. On the instrument's chart, it initiated a correction of the dominant uptrend. At the time of analysis, the wave structure does not show completion. The pair's price is near the upper boundary of a potential reversal zone.
Forecast:
During the coming week, overall sideways movement is expected. At the beginning of the week, a downward vector is more probable. Closer to the weekend, a reversal may form and price movement toward the resistance zone may resume.
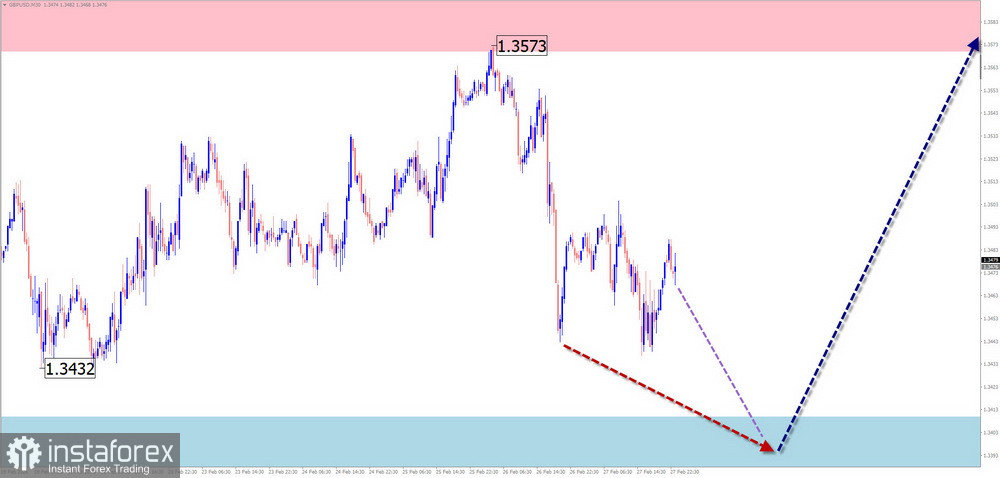
Potential Reversal Zones
Resistance:
- 1.3570/1.3620
Support:
- 1.3410/1.3360
Recommendations:
Sell positions: high risk, may result in losses.Buy positions: possible after confirmed reversal signals appear in the support zone.
AUD/USD
Analysis:
On the Australian dollar chart, the short-term trend since late January has been defined by a descending wave in the form of a shifting flat. In recent weeks, the wave structure has been developing an irregular correction, which remains unfinished. The calculated resistance runs along the lower boundary of the potential reversal zone.
Forecast:
In the coming days, an upward price pullback is most likely. The upside potential is limited by the calculated resistance levels. After that, a reversal and renewed downward movement toward the calculated support area are expected.
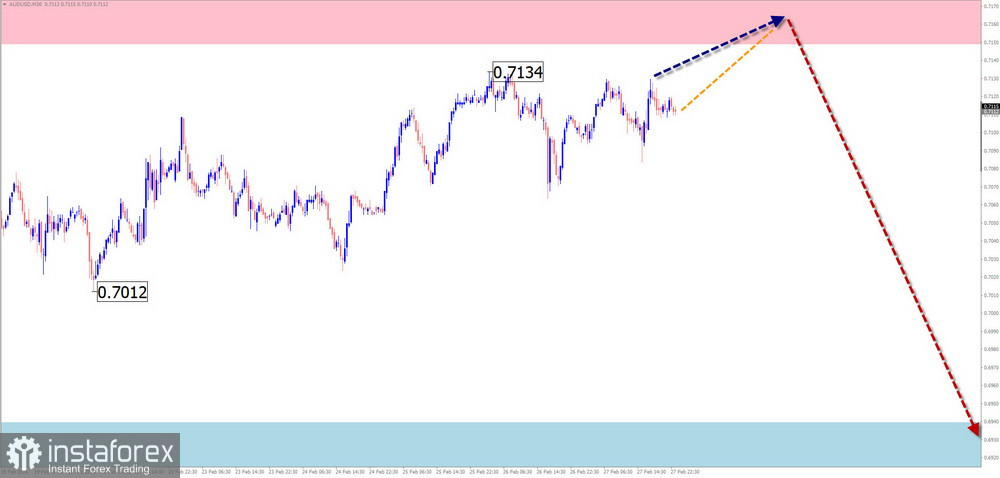
Potential Reversal Zones
Resistance:
- 0.7150/0.7200
Support:
- 0.6940/0.6890
Recommendations:
Buy positions: may be used with fractional volumes for intraday trading until the first signs of a trend change appear.Sell positions: possible after confirmed reversal signals appear near the resistance area according to your trading system.
USD/CHF
Analysis:
Over the past month, Swiss franc price fluctuations have remained within the framework of an upward correction of the unfinished main trend segment. At the time of analysis, the correction structure does not appear complete. The calculated support runs along the upper boundary of a large-scale potential reversal zone.
Forecast:
In the coming days, price movement toward the support zone boundaries is expected. By the end of the week, the probability of a reversal and resumption of a bullish movement toward the calculated resistance zone increases. A sharp rise in volatility is possible during the trend change, including a brief false break below support.
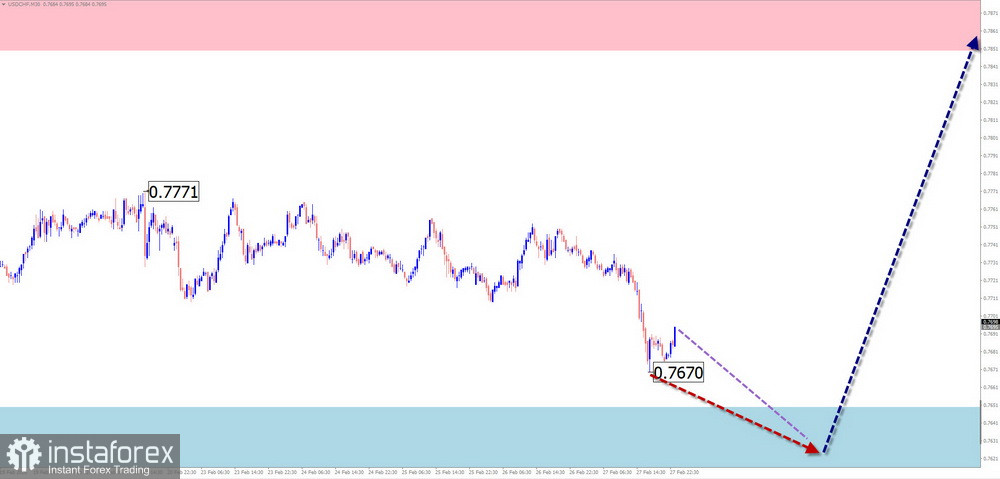
Potential Reversal Zones
Resistance:
- 0.7850/0.7900
Support:
- 0.7650/0.7600
Recommendations:
Buy positions: premature until confirmed reversal signals appear near the support zone.Sell positions: limited potential, risky.
EUR/JPY
Analysis:
On the euro/Japanese yen chart, an unfinished bearish wave started in October last year. Its structure, in the form of a shifting flat, currently appears complete. The upward segment at the end of February does not yet show reversal potential. It has brought quotes closer to a potential reversal zone.
Forecast:
At the beginning of the week, price movement along resistance boundaries is possible, including pressure on the upper boundary. Closer to the weekend, a reversal and renewed price decline are expected. A breakout beyond the calculated weekly boundaries is unlikely.
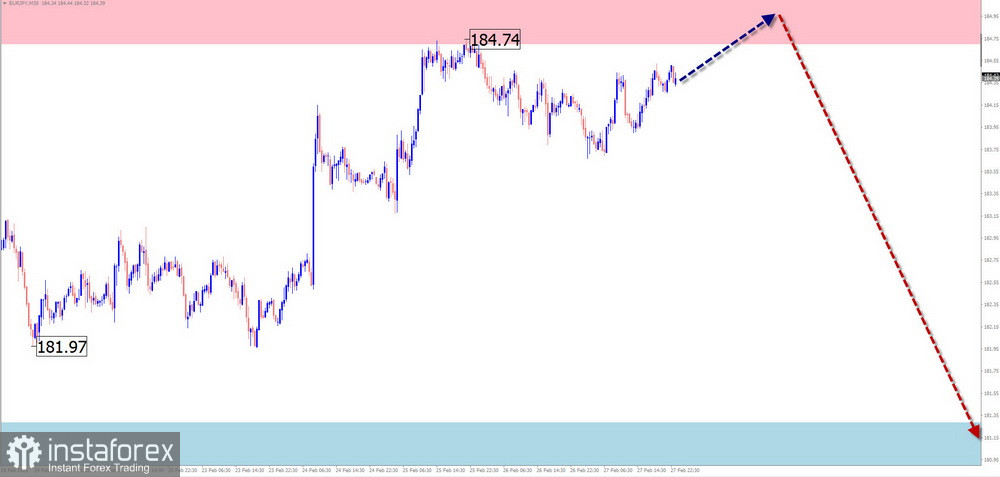
Potential Reversal Zones
Resistance:
- 184.70/185.20
Support:
- 181.30/180.80
Recommendations:
Buy positions: lack potential, may be unprofitable.Sell positions: become relevant after appropriate reversal signals appear.
AUD/JPY
Analysis:
An unfinished bullish wave on the Australian dollar chart since late January defines the main vector of the pair. Wave structure analysis indicates the formation of an irregular corrective pullback. There are no signs of an imminent reversal.
Forecast:
In the coming days, overall sideways movement is expected. Short-term pressure on calculated resistance is possible. By the end of the week, the likelihood of a direction change and the start of price decline increases. Weekly movement potential is limited by calculated zones.
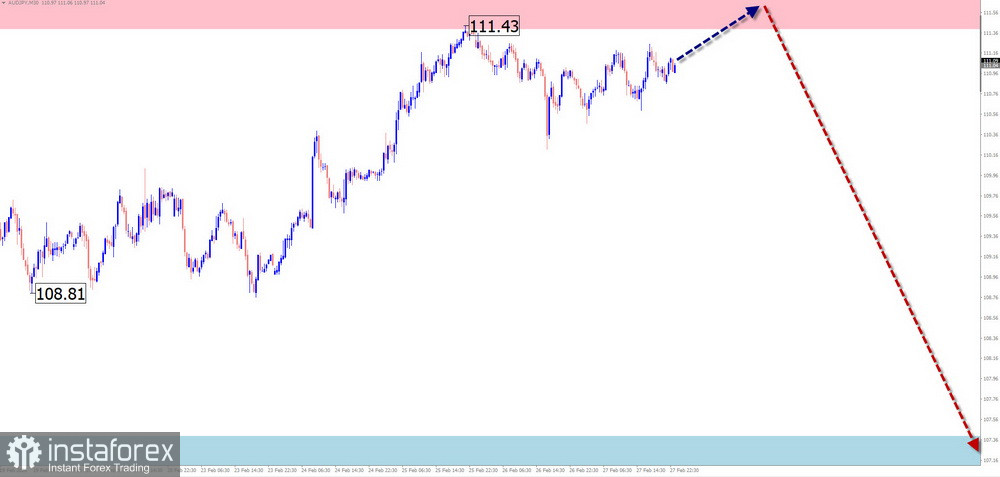
Potential Reversal Zones
Resistance:
- 111.40/111.90
Support:
- 107.40/106.90
Recommendations:
Sell positions: not advisable until confirmed reversal signals appear in the calculated reversal zone.Buy positions: limited potential. It is safer to reduce volume size and limit trades to session timeframes.
EUR/GBP
Analysis:
In the short term, price fluctuations are determined by the algorithm of an unfinished bearish wave that began on April 11 last year. Since November, quotes have been forming the beginning of the final (C) segment, which remains incomplete. Price is near the lower boundary of a broad weekly potential reversal zone.
Forecast:
In the coming days, sideways movement along calculated resistance boundaries is expected. By the end of the week, a reversal and renewed decline toward the support zone may form.
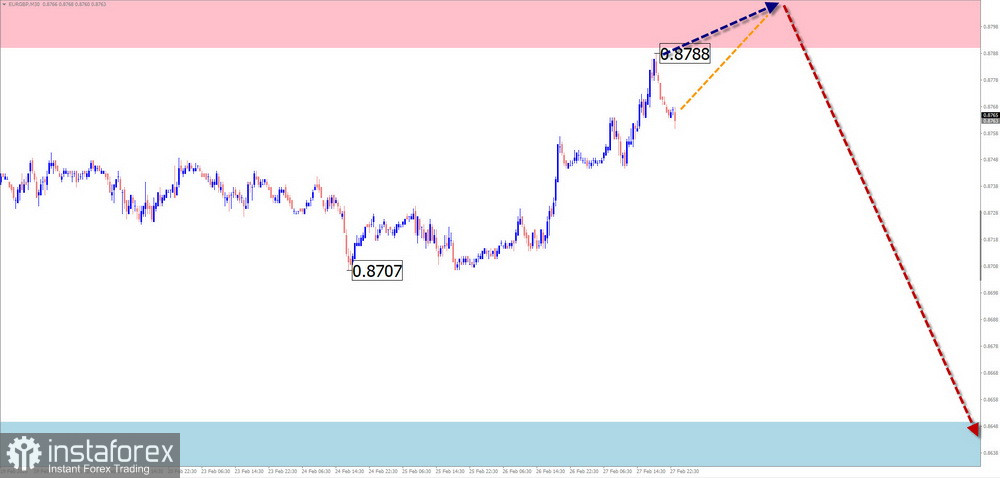
Potential Reversal Zones
Resistance:
- 0.8790/0.8840
Support:
- 0.8650/0.8600
Recommendations:
Buy positions: possible with fractional volumes within individual sessions.Sell positions: possible after confirmed reversal signals appear near the calculated reversal zone.
EUR/CHF
Analysis:
On the euro/Swiss franc pair market, the bearish trend dominates across all chart timeframes. Over the past three weeks, quotes have formed a correction within the unfinished segment of the wave that began on February 2. Last Friday, price rebounded from the lower boundary of a strong resistance zone.
Forecast:
During the upcoming week, overall sideways movement is expected. In the next couple of days, a short-term upward pullback cannot be ruled out. In the second half of the week, renewed price decline toward the calculated support zone is expected.
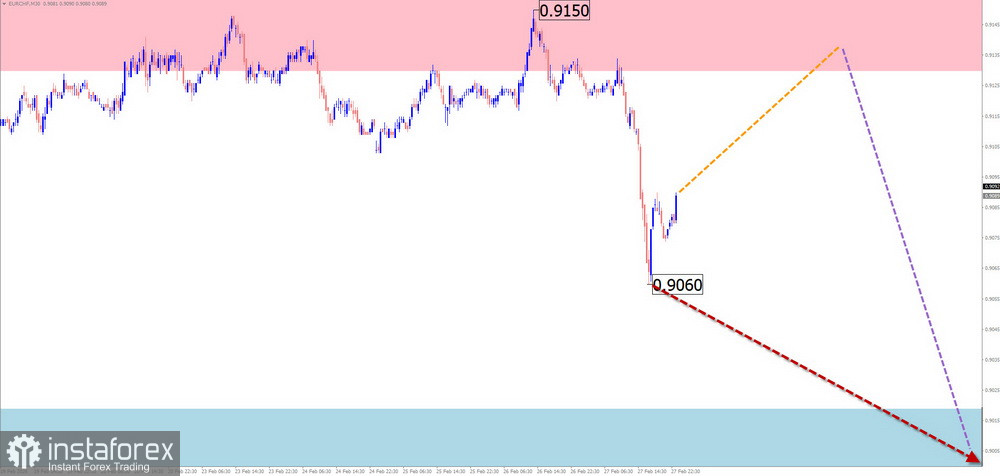
Potential Reversal Zones
Resistance:
- 0.9130/0.9180
Support:
- 0.9020/0.8970
Recommendations:
Buy positions: risky, may result in losses.Sell positions: possible within individual sessions with reduced volume size. Trade potential is limited by calculated support.
Ethereum
Analysis:
Analysis of the 4-hour chart shows that the unfinished Ethereum wave is directed downward, counting from August last year. The wave structure is close to completion. Price continues to fluctuate within a corridor between nearby opposing zones.
Forecast:
Next week, continued overall sideways movement is expected. In the first days, an upward vector is more likely, including possible pressure on upper resistance. Later, a reversal and renewed decline toward the support zone are expected.
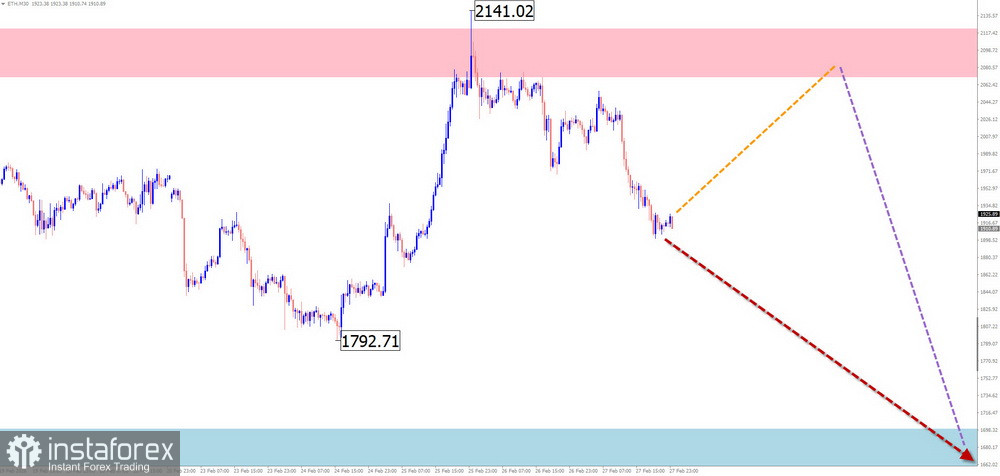
Potential Reversal Zones
Resistance:
- 2070/2170
Support:
- 1700/1600
Recommendations:
Buy positions: limited potential and high risk.Sell positions: possible after appropriate reversal signals appear in your trading systems.
Litecoin
Analysis:
Since October last year, Litecoin's short-term direction has been defined by a descending wave algorithm. Over the past three weeks, quotes have formed a corrective flat within this structure. Price is near the boundary of a strong support zone. No signs of an imminent trend change are currently visible.
Forecast:
During the upcoming week, overall sideways movement is expected. In the first days, a general upward vector is possible. A reversal and renewed decline may form either at the end of this week or during the next weekly period.
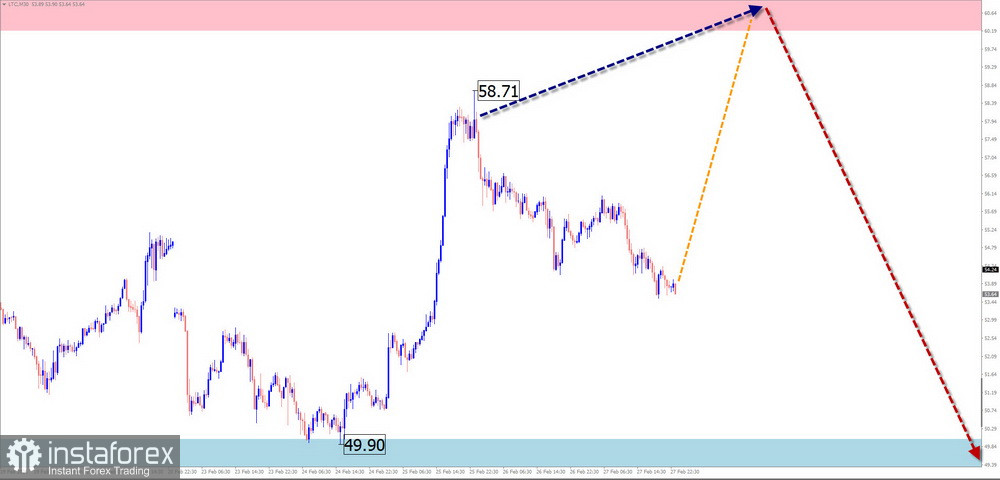
Potential Reversal Zones
Resistance:
- 60.20/61.20
Support:
- 50.00/49.00
Recommendations:
Buy positions: limited potential, risky.Sell positions: possible after appropriate signals appear in your trading systems.
Notes: In simplified wave analysis (SWA), all waves consist of three parts (A–B–C). On each timeframe, the last unfinished wave is analyzed. Dashed lines indicate expected movements.
Attention: The wave algorithm does not take into account the duration of price movements over time.