 English
  Русский
 Bahasa Indonesia
 Bahasa Malay
 ไทย
ไทย Español
 Deutsch
 Български
 Français
 Tiếng Việt
 中文
中文 বাংলা
বাংলা हिन्दी
 Čeština
 Українська
 Română


Having started the week and month with a sharp drop at the open, markets enter a new phase of high volatility in which traditional risk-off flows collide with uncertainty about monetary policy and corporate outlooks. Geopolitical risk dominates, and the coming days may be critical: escalation could lead to a deeper correction, as we suggested in our fundamental analysis and the review "DJIA: geopolitical shock and turbulence at the start of the week."
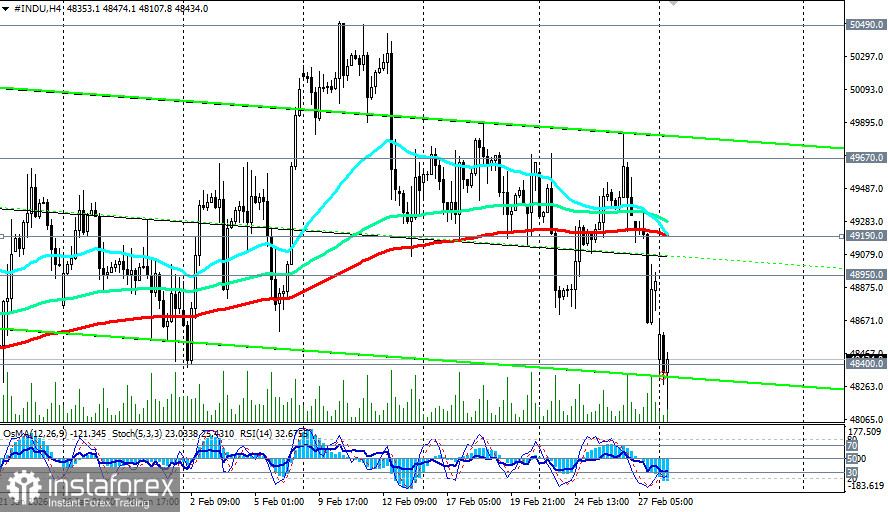
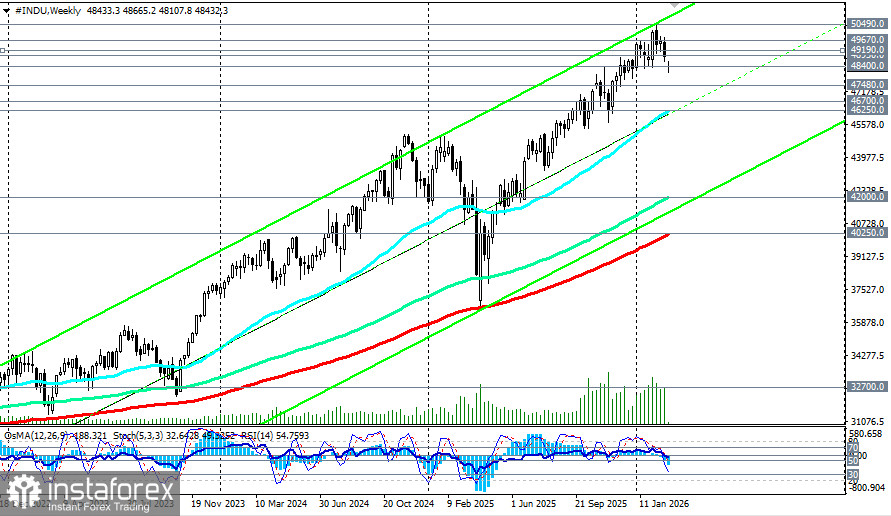
In that case, a break of local support at 48,400.0, and then today's low at 48,108.0, could trigger further declines toward the important medium-term support level at 47,480.0 (EMA144 on the daily chart). A deeper fall would imply a sharper deterioration in the Middle East situation and push the index toward the 47,000.0–46,700.0 support zone (EMA200 on the daily). A break of the key support at 46,250.0 (EMA50 and the midline of the rising channel on the weekly INDU chart) would confirm the transition of the DJIA into a medium-term bear market, with risks of a drop to the lower boundary of that channel and to long-term support levels at 42,000.0 (EMA144 on the weekly) and 40,250.0 (EMA200 on the weekly), which separate the DJIA's long-run bull market from a bear phase.
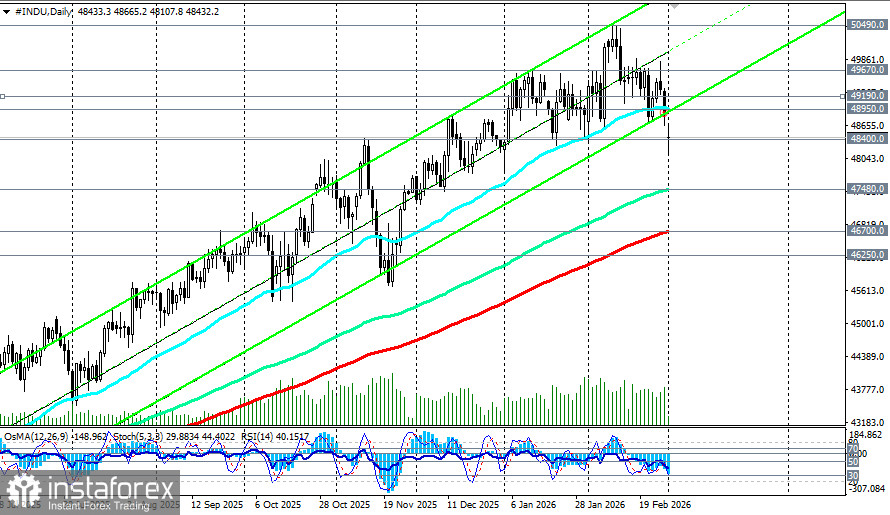
It is not necessary to look far for evidence that such blow-offs and bubble collapses periodically occur in the equity market: observe DJIA's dynamics in February–March 2025, exactly a year ago, when the price fell from a local high to a local low over 10–11 weeks by 23%.
In the bullish scenario, from current levels and from today's local low, a technical rebound will occur, which, in fact, we are now seeing ahead of the US trading session.
The start of negotiations, as we noted, may reduce the geopolitical premium and produce a technical rebound to 49,500.0–49,700.0 (a local resistance zone). A break above today's high at 48,665.0 and further advance that closes the gap could serve as a confirming signal.
In the base case we expect a resumption of the uptrend and further record highs above 50,490.0, but only on a sharp de-escalation of the conflict around Iran and dovish signals from the Fed.
- Support levels: 48,400.0, 48,200.0, 48,000.0, 47,480.0, 47,000.0, 46,700.0, 46,250.0, 46,000.0
- Resistance levels: 48,665.0, 48,950.0, 49,000.0, 49,190.0, 49,670.0, 49,700.0, 50,000.0, 50,200.0, 50,490.0, 51,000.0
- Upside targets: 48,665.0, 48,950.0, 49,000.0, 49,190.0, 49,670.0, 49,700.0, 50,000.0, 50,200.0, 50,490.0, 51,000.0, 52,000.0
- Downside targets: 48,200.0, 48,000.0, 47,480.0, 47,000.0, 46,700.0, 46,250.0, 46,000.0, 45,000.0, 42,000.0, 41,000.0
*) Here targets correspond to support/resistance levels. This does not mean they will necessarily be reached, but they can serve as reference points when planning and placing trades.
+ open a trading account
+ register for the signal-copying system
+ invest via the PAMM system