 English
  Русский
 Bahasa Indonesia
 Bahasa Malay
 ไทย
ไทย Español
 Deutsch
 Български
 Français
 Tiếng Việt
 中文
中文 বাংলা
বাংলা हिन्दी
 Čeština
 Українська
 Română

Analysis of Macroeconomic Reports:
There are quite a few macroeconomic reports scheduled for Friday, including some truly important ones. First and foremost, beginner traders should pay attention to the Nonfarm Payrolls and the unemployment rate reports from the US. Recall that these reports may show weak values, but values above or better than forecasts could lead to a renewed rise in the dollar. Additionally, reports on retail sales and wages will be released in the US, which have less impact on the dollar's exchange rate. In the Eurozone, a fourth-quarter GDP report will be published in its third estimate, unlikely to surprise the market or provoke a significant reaction.
Analysis of Fundamental Events:
General Conclusions:
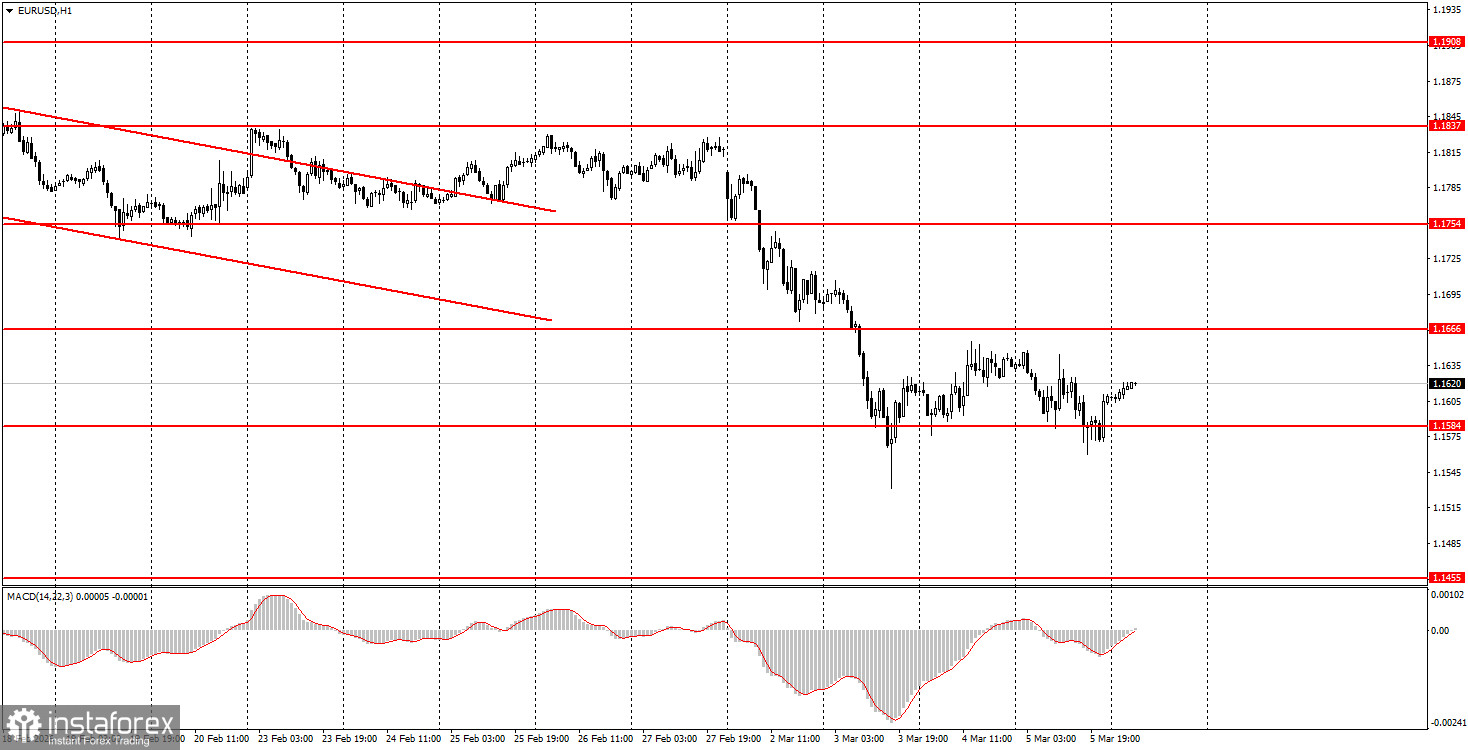
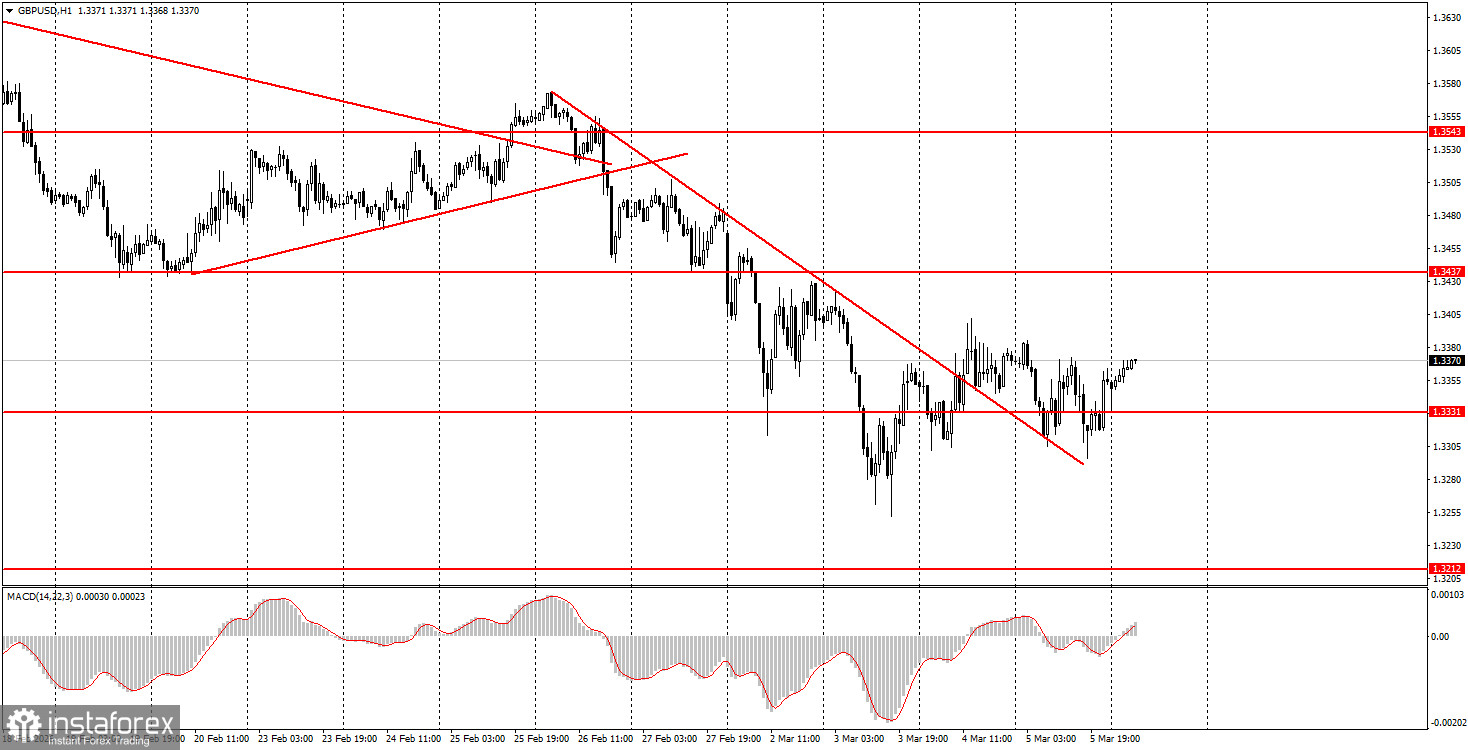
On the last trading day of the week, the market may experience any movement, as events in the Middle East continue to shake it. Additionally, important reports will be published in the US today, which will not go unnoticed. The euro can be traded today in the range of 1.1584-1.1591, while the British pound can be traded in the range of 1.3319-1.3331. We still see no grounds for a strong and prolonged rise in the American currency; however, the war in the Middle East may continue to pull both pairs down.
Key Principles of the Trading System:
- The strength of a signal is determined by the time it takes to form the signal (bounce or breakout). The less time taken, the stronger the signal.
- If two or more trades have been opened at a particular level based on false signals, all subsequent signals from that level should be ignored.
- In a flat market, any pair can form many false signals or none at all. In any case, at the first signs of a flat trend, it is best to stop trading.
- Trading deals are to be opened during the period between the start of the European session and the mid-American session, after which all trades should be closed manually.
- On the hourly timeframe, it is preferable to trade based on signals from the MACD indicator only when there is good volatility and a trend confirmed by a trend line or trend channel.
- If two levels are positioned too close together (5-20 pips apart), they should be considered a support or resistance area.
- Upon moving 15-20 pips in the correct direction, a Stop Loss should be set to breakeven.
What to Look for on the Charts:
Price levels of support and resistance are levels that serve as targets when opening buys or sells. Take Profit levels can be placed around them.
Red lines represent channels or trend lines that show the current trend and indicate the direction in which it is preferable to trade now.
The MACD indicator (14,22,3) – the histogram and the signal line – is a supporting indicator that can also be used as a source of signals.
Important speeches and reports (always included in the news calendar) can significantly affect the movement of the currency pair. Therefore, during their release, trading should be done with utmost caution, or traders should exit the market to avoid sharp price reversals against the previous movement.
Beginning traders in the forex market should remember that not every trade can be profitable. Developing a clear strategy and effective money management are the keys to long-term trading success.