 English
  Русский
 Bahasa Indonesia
 Bahasa Malay
 ไทย
ไทย Español
 Deutsch
 Български
 Français
 Tiếng Việt
 中文
中文 বাংলা
বাংলা हिन्दी
 Čeština
 Українська
 Română

Bitcoin continues to show no particular desire to rise. Last week, we saw prices increase from $63,500 to $74,000, but today the quotes dropped to $66,500. Thus, "digital gold" has failed to develop an upward impulse once again. We remind you that all movements over the past month (especially the last two weeks) are fully aligned with the technical picture. Two deviations from the lower boundary of the flat have resulted in a rise to the upper boundary. A deviation from the upper boundary of the flat has led to a return to the lower boundary.
Meanwhile, one of the founders of Bitcoin Vector, well-known investor Willy Woo, stated that the current range is unlikely to be considered the "bottom" of the market. He indicated that the current lackluster growth in Bitcoin, observed for a month, could be a precursor to a new crash. "Weak and unconvincing growth can create the illusion of a new bullish trend, but it could be a trap," Woo believes. The expert noted that he bases his conclusions not on price changes but on liquidity indicators. Currently, there are no signs of large capital returning to the cryptocurrency market. When the volumes return, then a bullish trend can be expected.
Woo believes that the situation with Bitcoin's corrective growth could continue until the end of April. We can add that during this time, the market might attempt to form the illusion for retail traders that the downward impulse has ended. We believe that the basis for a shift in sentiment toward the upside can only be the formation of strong bullish signals and reversal patterns, which are currently absent. Willy Woo also mentioned that large capital is not currently interested in new long-term Bitcoin purchases, and the falling U.S. stock market is an additional factor pressuring the world's first cryptocurrency.
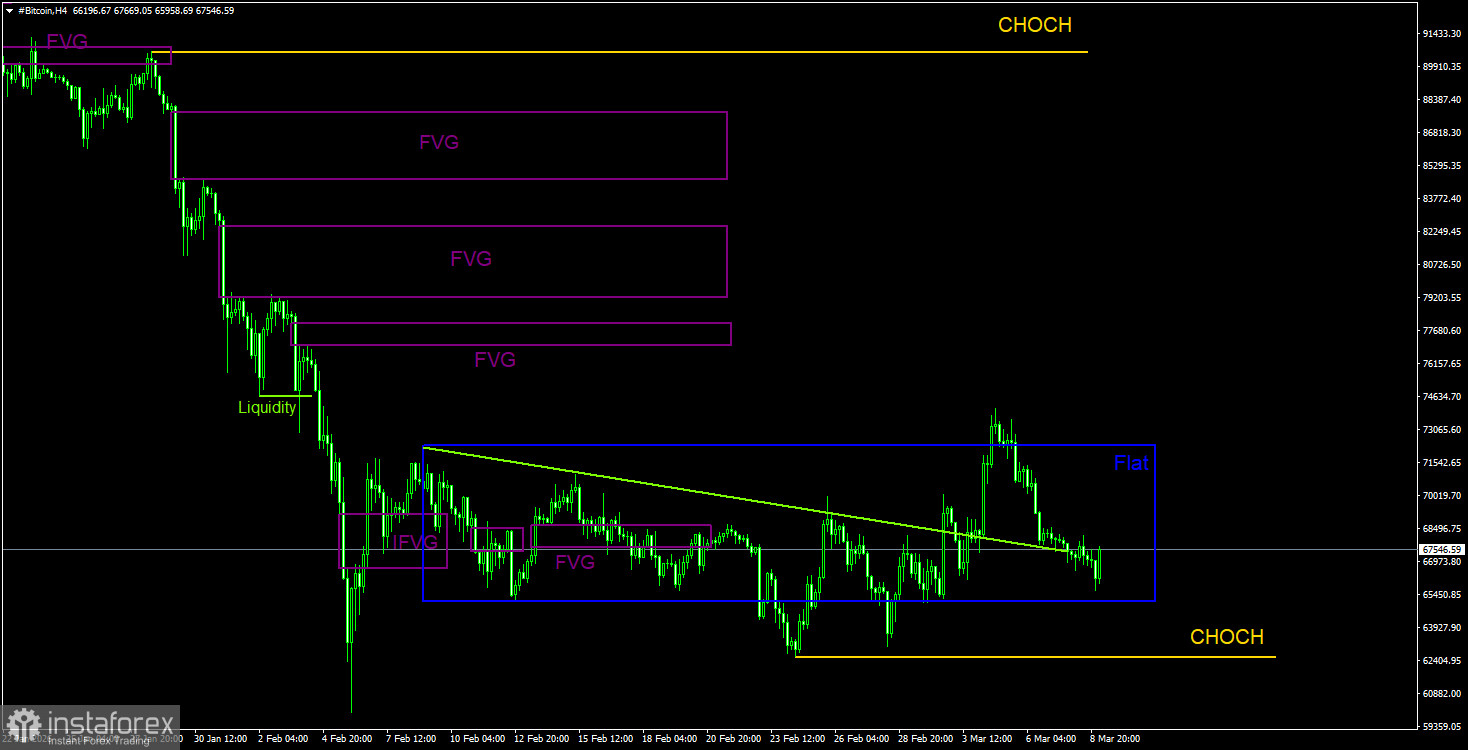
Trading Recommendations for BTC/USD:
Bitcoin continues to form a full downward trend. We continue to expect a decline, targeting $57,500 (the 61.8% Fibonacci level of the three-year upward trend), and there are currently no signs of a trend reversal. Even the $57,500 level no longer looks like a final stop. Among the POI areas, we can currently note only the nearest "bearish" FVG on the daily timeframe, which is quite far from the price. On the 4-hour timeframe, a new deviation from the lower boundary may form soon.
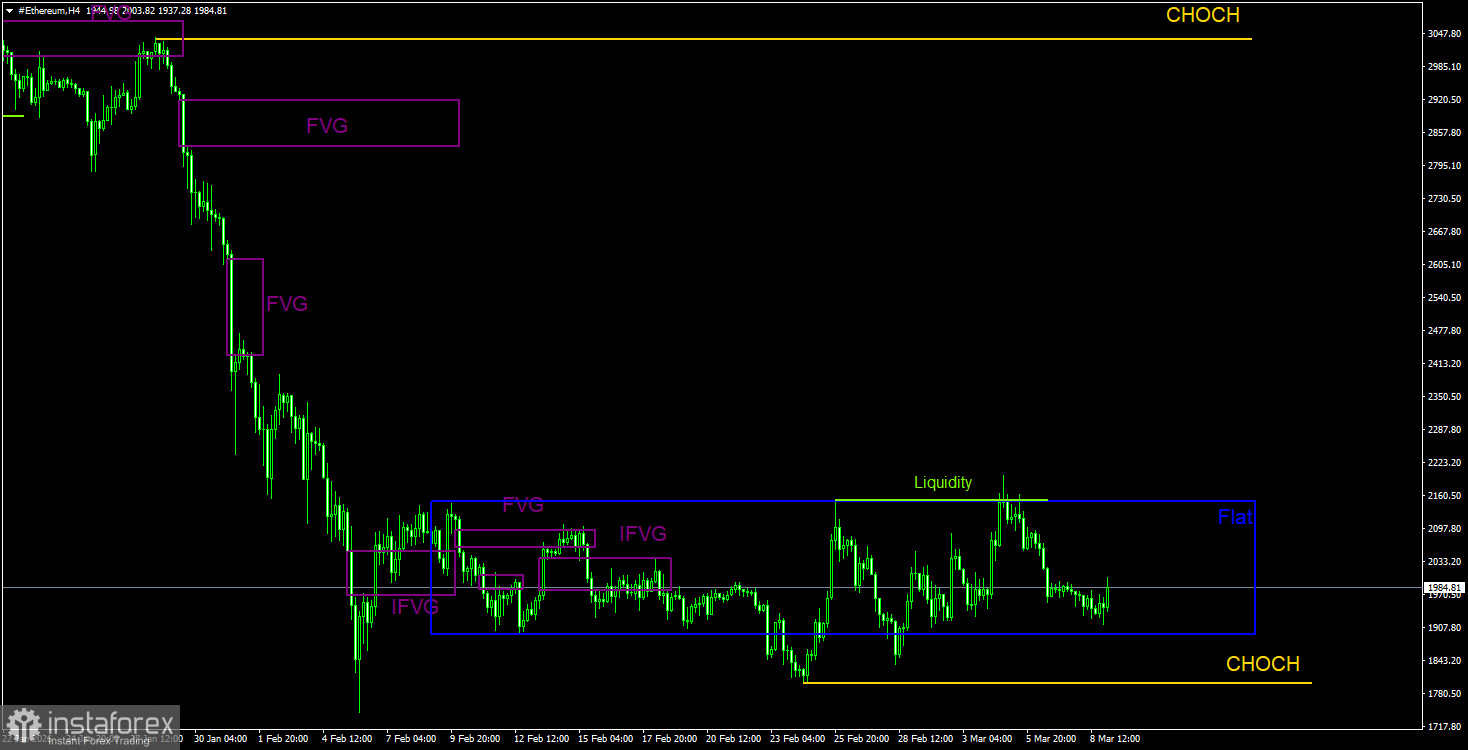
Trading Recommendations for ETH/USD:
On the daily timeframe, the downward trend continues to form. The key sell pattern has been and remains a bearish order block on the weekly timeframe. As we warned, the movement spurred by this signal can be strong and long-lasting. After its formation, Ethereum has already depreciated by 55% or $2,500. In the near future, we can still expect an upward correction, but the price is still in a fairly narrow sideways channel within the downward trend. Trading inside the flat can only be done from its boundaries. Recently, a sell signal was formed in the form of a deviation at the upper boundary of the sideways channel at $1,892 - $2,150, so it is entirely logical that the price has dropped to the lower boundary. We should now expect new signals to form around the lower boundary.
Explanations for Illustrations:
CHOCH – Change of Character in the trend structure.
Liquidity – The liquidity, Stop Loss of traders, which market makers use to build their positions.
FVG – Area of price inefficiency. The price passes through these areas very quickly, indicating a complete absence of one side in the market. Subsequently, the price tends to return and react to such areas.
IFVG – Inverted area of price inefficiency. After returning to such an area, the price does not respond but impulsively breaks through and then tests it from the other side.
OB – Order Block. The candle on which the market maker opened a position with the aim of capturing liquidity to form their position in the opposite direction.