 English
  Русский
 Bahasa Indonesia
 Bahasa Malay
 ไทย
ไทย Español
 Deutsch
 Български
 Français
 Tiếng Việt
 中文
中文 বাংলা
বাংলা हिन्दी
 Čeština
 Українська
 Română

Analysis of Trades and Trading Tips for the Japanese Yen
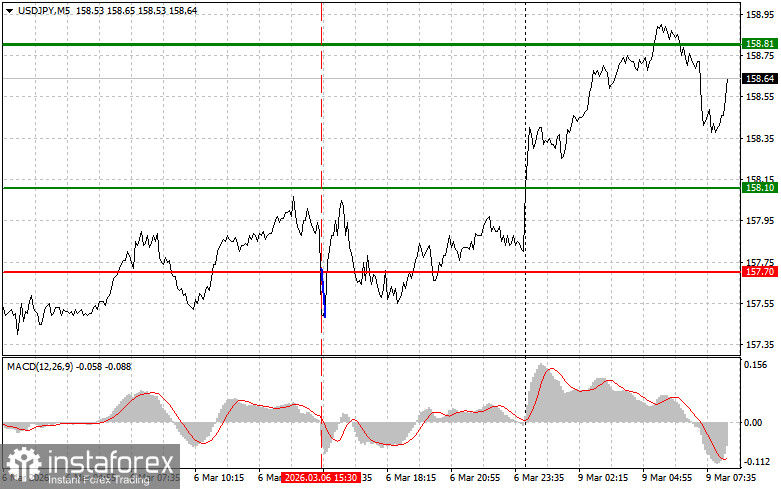
The price test at 157.70 occurred when the MACD indicator was just beginning to move downward from the zero mark, confirming the correct entry point for selling dollars. As a result, the pair decreased by 25 pips, after which the pressure eased.
Despite the U.S. non-farm sector losing 92,000 jobs and unemployment rising to 4.4% in February, the data did not provide significant support for the Japanese yen, which remains under pressure. This paradoxical result in the currency market raises questions about the reasons behind the current dynamics. On one hand, the negative dynamics in the U.S. labor market typically signal an economic slowdown, which should strengthen the yen as a safe haven during periods of uncertainty. On the other hand, the escalation of the geopolitical conflict in the Middle East, occurring with direct U.S. involvement, supports the dollar at such times.
As for the intraday strategy, I will focus more on implementing Scenarios No. 1 and No. 2.
Buying Scenarios
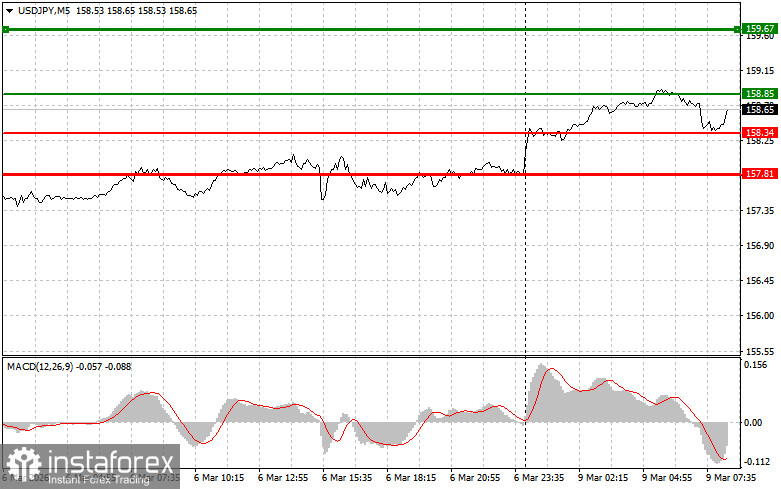
Scenario No. 1: Today, I plan to buy USD/JPY at around 158.85 (green line on the chart), targeting a move to 159.67 (thicker green line on the chart). At 159.67, I plan to exit my long positions and open shorts in the opposite direction (expecting a move of 30-35 pips from the entry point). It is best to resume buying the pair on corrections and significant pullbacks in USD/JPY. Important! Before buying, ensure the MACD indicator is above the zero mark and just starting to rise from it.
Scenario No. 2: I also plan to buy USD/JPY today in the event of two consecutive tests of the price at 158.34 when the MACD indicator is in the oversold area. This will limit the pair's downside potential and lead to an upward market reversal. An increase towards the opposite levels of 158.85 and 159.67 can be expected.
Selling Scenarios
Scenario No. 1: I plan to sell USD/JPY today only after breaking the level of 158.34 (red line on the chart), which will lead to a rapid decline of the pair. The key target for sellers will be the 157.81 level, where I plan to exit my shorts and immediately buy in the opposite direction (expecting a move of 20-25 pips from the level). It is better to sell as high as possible. Important! Before selling, ensure the MACD indicator is below the zero mark and just starting to decline from it.
Scenario No. 2: I also plan to sell USD/JPY today in the event of two consecutive tests of the price at 158.85 when the MACD indicator is in the overbought area. This will limit the upward potential of the pair and lead to a market reversal downward. A decline towards the opposite levels of 158.34 and 157.81 can be expected.
What's on the Chart:
- The thin green line represents the entry price at which you can buy the trading instrument;
- The thick green line is the assumed price where you can set Take Profit or manually take profit, as further growth above this level is unlikely;
- The thin red line indicates the entry price at which you can sell the trading instrument;
- The thick red line is the assumed price where you can set Take Profit or manually take profit, as further decline below this level is unlikely;
- The MACD indicator. When entering the market, it's important to refer to the overbought and oversold zones.
Important: Beginner traders in the forex market need to make entry decisions very carefully. It is best to stay out of the market before the release of important fundamental reports to avoid sharp fluctuations in prices. If you choose to trade during the release of news, always set Stop Loss orders to minimize losses. Without placing Stop Loss orders, you can quickly lose your entire deposit, especially if you do not use money management and trade large volumes.
And remember, successful trading requires a clear trading plan, like the one presented above. Making spontaneous trading decisions based on the current market situation is inherently a losing strategy for intraday traders.