 English
  Русский
 Bahasa Indonesia
 Bahasa Malay
 ไทย
ไทย Español
 Deutsch
 Български
 Français
 Tiếng Việt
 中文
中文 বাংলা
বাংলা हिन्दी
 Čeština
 Українська
 Română

The GBP/USD currency pair finally showed a solid rise on Thursday. The British pound remains near a local low despite everything, but on Thursday, it was able to improve its position slightly. On Wednesday evening, the Federal Reserve announced the results of its second meeting of 2026 and, amid the conflict in the Middle East and the sharp rise in energy prices, the US central bank had to adopt a more hawkish stance for 2026. This is clear, and there are no questions about it, just as there are no questions regarding the moderately strong appreciation of the US dollar.
The next day, the questions did not disappear. It is worth recalling that over the past month and a half, the market has used any opportunity to buy dollars. This approach has seemed logical in recent weeks due to events in the Middle East, which have hit the energy sector across almost the entire world. However, even before the war in Iran, the British pound was falling, and the dollar was rising. Although the macroeconomic background did not always support such a scenario.
This week, we witnessed two central bank meetings—the Fed and the Bank of England. The decisions taken were practically identical, with the rhetoric of both central banks becoming tougher due to concerns about accelerating inflation. None of the members of the BoE's Monetary Committee voted for a rate cut, although experts expected at least two votes. Finally, the market did not ignore the growth factor in the GBP/USD pair, but clearly responded to it. Perhaps such a strong reaction was solely due to the BoE's meeting, or perhaps the geopolitical factor has begun to have less impact on traders' sentiment. Either way works for us. Thus, for the first time in a month and a half, the market reacted to British news as it should.
However, one day is not a definitive indicator. The US dollar can continue to rise for a long time if the war in Iran persists. We cannot predict how high the US dollar may rise, as it will depend on Donald Trump (who is rumored to be ready to end the war in Iran) and the conflict in the Middle East. However, it is now less important what Trump wants. What matters is what the wounded Tehran wants. Yesterday morning, a missile strike was carried out on another significant oil refining hub in Saudi Arabia, followed shortly by attacks on Qatari and Israeli oil and gas enterprises. Therefore, the flow of oil and gas from the Middle East is now even more paralyzed than before. Oil prices reacted immediately with a further rise, meaning the US dollar has every reason to strengthen again.
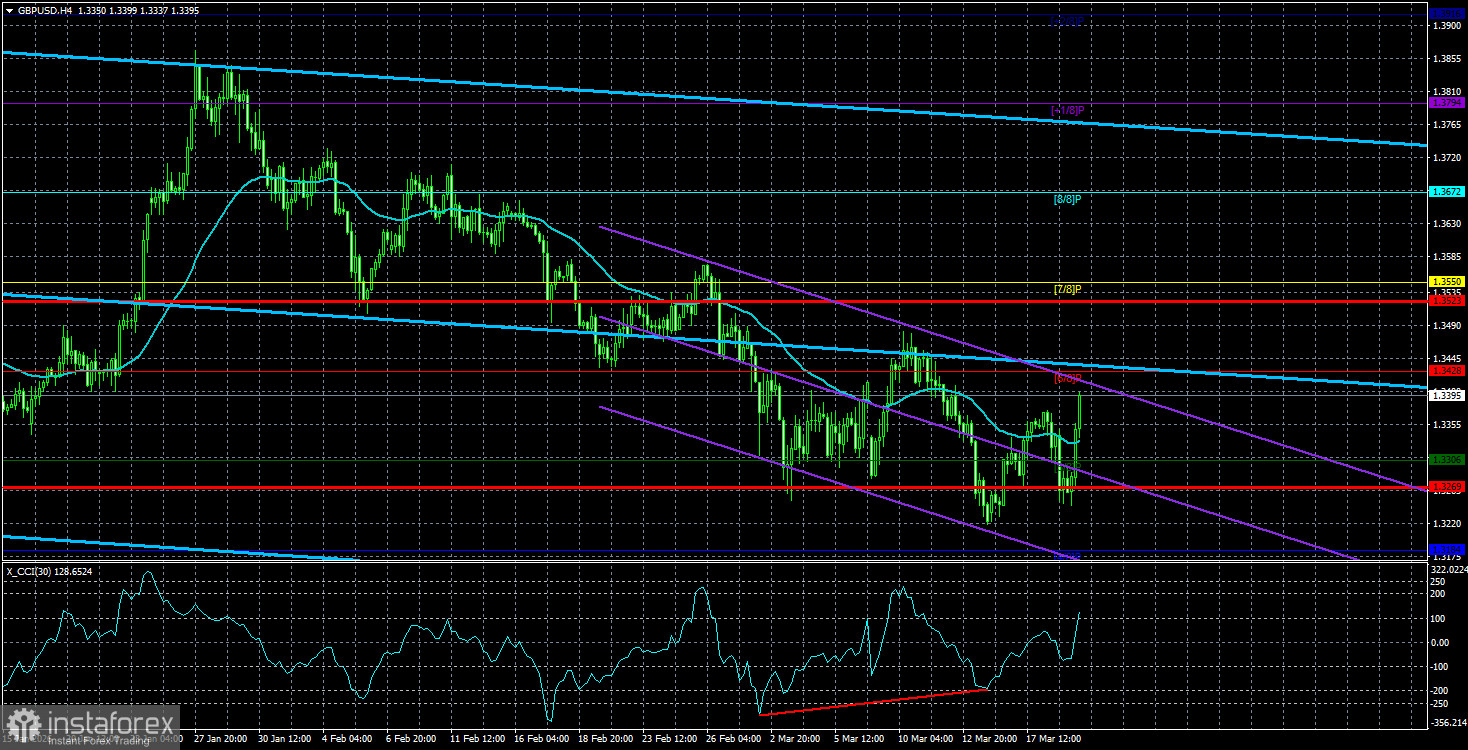
From a technical standpoint, we still consider the current one-and-a-half-month decline a correction, but it should be noted that only geopolitics currently determines the direction of price movement.
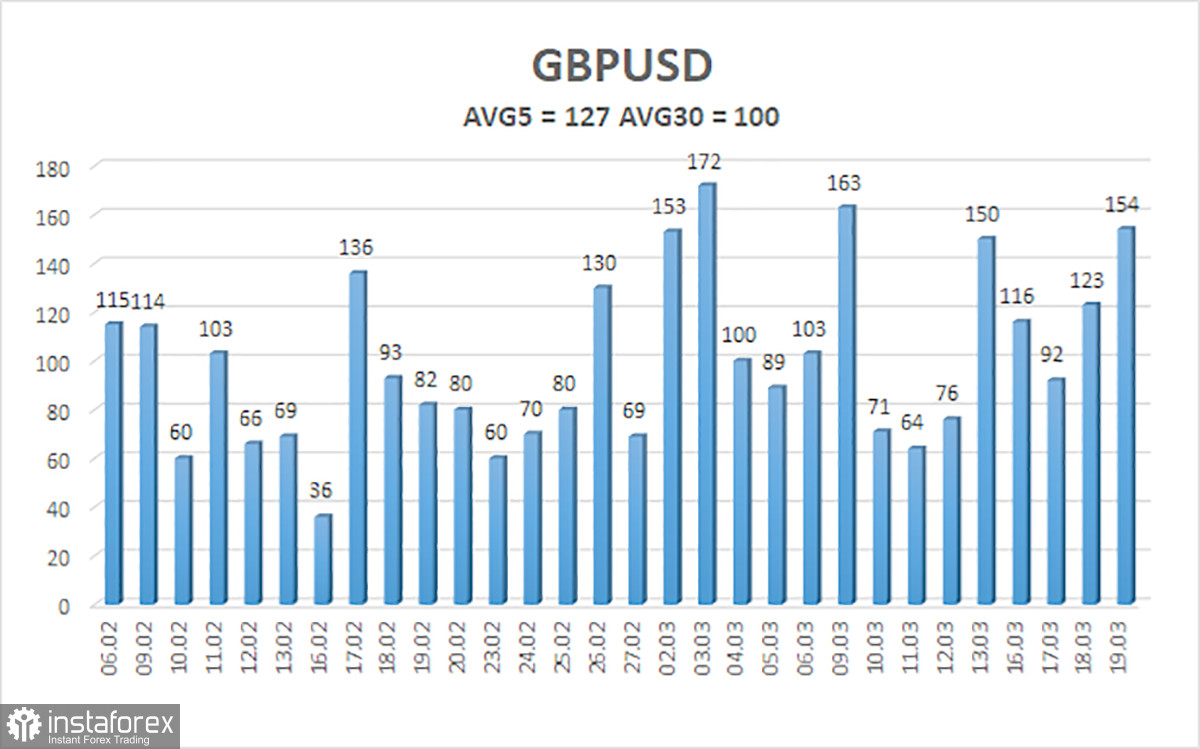
The average volatility of the GBP/USD pair over the last five trading days is 127 pips, which is considered "average" for the pound/dollar pair. On Friday, March 20, we expect the pair to move within a range bounded by levels 1.3269 and 1.3523. The upper linear regression channel has flattened, suggesting a potential trend reversal. The CCI indicator has entered the oversold area twice, which once again warned of the completion of the correction and also formed a new "bullish" divergence.
Nearest Support Levels:
S1 – 1.3306
S2 – 1.3184
S3 – 1.3062
Nearest Resistance Levels:
R1 – 1.3428
R2 – 1.3550
R3 – 1.3672
Trading Recommendations:
The GBP/USD pair continues to correct after a month and a half, but its long-term prospects remain unchanged. Trump's policies will continue to pressure the US economy, so we do not expect the US currency to grow in 2026. Therefore, long positions with a target of 1.3916 and above remain relevant as long as the price is above the moving average. If the price is below the moving average line, small short positions can be considered, with targets at 1.3269 and 1.3184, based on geopolitical factors. In recent weeks, virtually all news and events have turned against the British pound, prolonging the correction.
Explanations for Illustrations:
- Linear regression channels help determine the current trend. If both are directed in the same way, then the trend is strong at the moment;
- The moving average line (settings 20,0, smoothed) determines the short-term trend and the direction of trading;
- Murray levels – target levels for movements and corrections;
- Volatility levels (red lines) – the probable price channel in which the pair will move in the upcoming days based on current volatility readings;
- The CCI indicator – its entry into the oversold area (below -250) or the overbought area (above +250) indicates that a trend reversal is approaching in the opposite direction.