 English
  Русский
 Bahasa Indonesia
 Bahasa Malay
 ไทย
ไทย Español
 Deutsch
 Български
 Français
 Tiếng Việt
 中文
中文 বাংলা
বাংলা हिन्दी
 Čeština
 Українська
 Română

Analysis of Wednesday's Trades:
1H Chart of the EUR/USD Pair
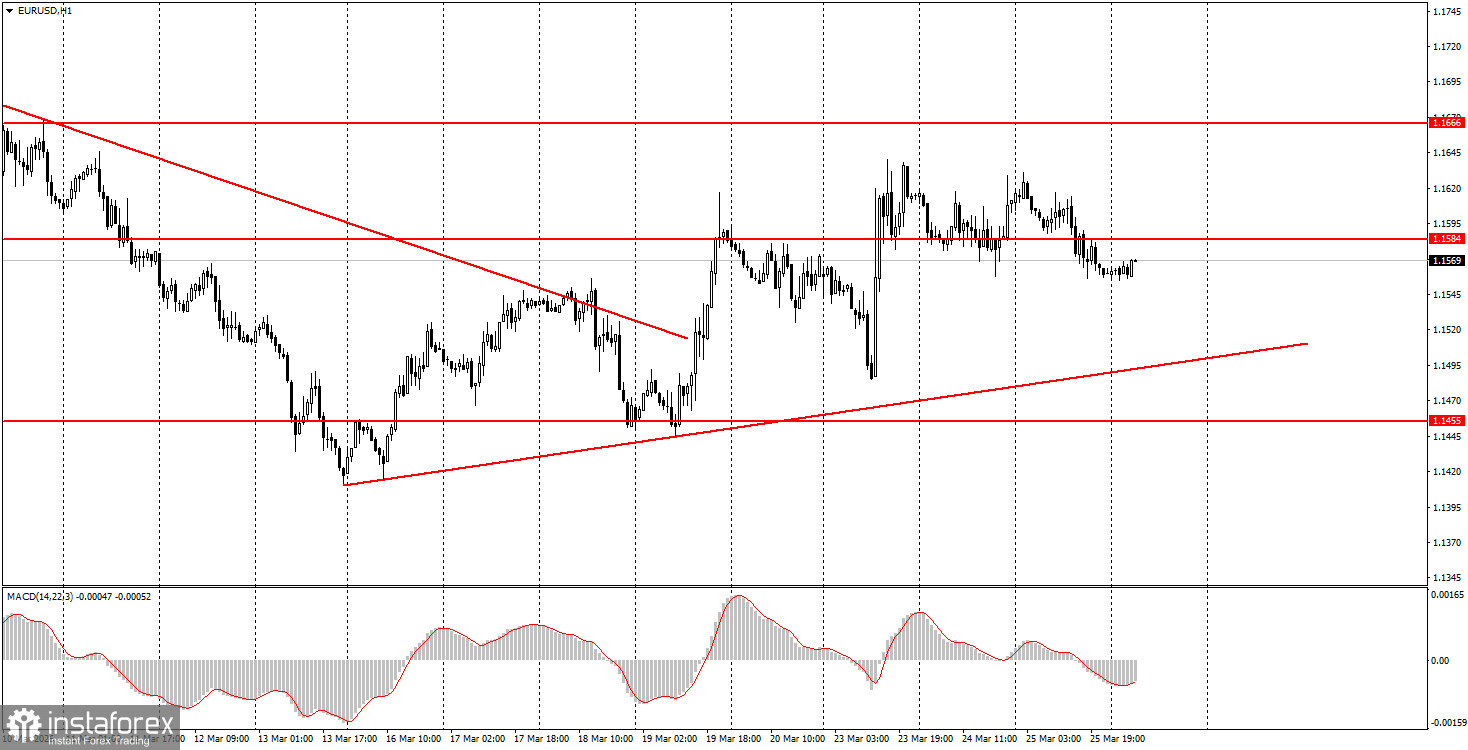
The EUR/USD currency pair showed no notable movements on Wednesday. There was a lack of macroeconomic background during the day; Christine Lagarde's speech did not provide any insights for traders, and there was no encouraging or escalating news from the Middle East. All we learned throughout the day was Iran's rejection of any negotiations with the US, as well as the US's preparations (despite earlier statements from Trump) for a ground operation in Iran. Therefore, at this point, it can be confidently stated that there is no talk of de-escalation in the Middle East in the near term. If Trump initiates a ground operation in Iran, it could further exacerbate the current situation in energy markets. Inflation may rise further globally, and the dollar could rise again as a safe-haven asset. Thus, a ground operation at this time could trigger a new decline in the EUR/USD pair. Technically, the upward trend on the hourly timeframe remains intact.
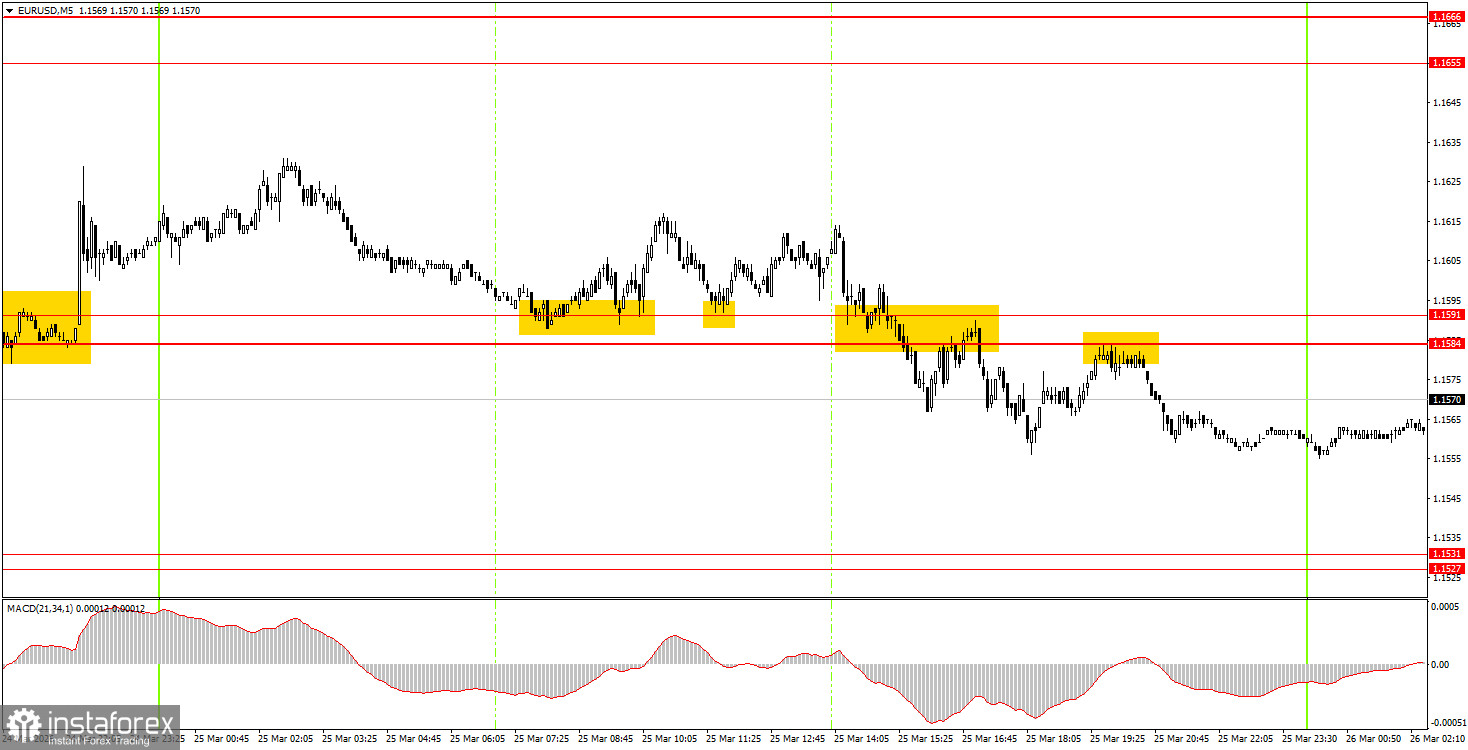
5M Chart of the EUR/USD Pair
How to Trade on Wednesday:
On the hourly timeframe, the downward trend is completed, but we may be dealing with yet another ordinary upward correction. In early 2026, a long-term upward trend resumed, so we still expect medium-term growth for the euro. The fundamental background remains very challenging for the American currency; however, geopolitics is currently the main focus for the market. It is precisely this that prevents the dollar from falling.
On Thursday, novice traders may consider short positions in the event of a bounce from the 1.1584-1.1591 area, with a target of 1.1527-1.1531. If the price consolidates above the 1.1584-1.1591 area, long positions can be opened with a target of 1.1655-1.1666.
On the 5-minute timeframe, one should consider the levels 1.1267-1.1292, 1.1354-1.1363, 1.1413, 1.1455-1.1474, 1.1527-1.1531, 1.1584-1.1591, 1.1655-1.1666, 1.1745-1.1754, 1.1830-1.1837, 1.1899-1.1908. On Thursday, there are no significant events to note. The consumer confidence index will be published in Germany, while the US will see jobless claims released.
Key Principles of the Trading System:
- The strength of a signal is determined by the time it takes to form the signal (bounce or breakout). The less time taken, the stronger the signal.
- If two or more trades have been opened at a particular level based on false signals, all subsequent signals from that level should be ignored.
- In a flat market, any pair can form many false signals or none at all. In any case, at the first signs of a flat trend, it is best to stop trading.
- Trading deals are to be opened during the period between the start of the European session and the mid-American session, after which all trades should be closed manually.
- On the hourly timeframe, it is preferable to trade based on signals from the MACD indicator only when there is good volatility and a trend confirmed by a trend line or trend channel.
- If two levels are positioned too close together (5-20 pips apart), they should be considered a support or resistance area.
- Upon moving 15 pips in the correct direction, a Stop Loss should be set to breakeven.
What to Look for on the Charts:
Price levels of support and resistance are levels that serve as targets when opening buys or sells. Take Profit levels can be placed around them.
Red lines represent channels or trend lines that show the current trend and indicate the direction in which it is preferable to trade now.
The MACD indicator (14,22,3) – the histogram and the signal line – is a supporting indicator that can also be used as a source of signals.
Important speeches and reports (always included in the news calendar) can significantly affect the movement of the currency pair. Therefore, during their release, trading should be done with utmost caution, or traders should exit the market to avoid sharp price reversals against the previous movement.
Beginning traders in the forex market should remember that not every trade can be profitable. Developing a clear strategy and effective money management are the keys to long-term trading success.