 English
  Русский
 Bahasa Indonesia
 Bahasa Malay
 ไทย
ไทย Español
 Deutsch
 Български
 Français
 Tiếng Việt
 中文
中文 বাংলা
বাংলা हिन्दी
 Čeština
 Українська
 Română

Analysis of Wednesday's Trades:
1H Chart of the GBP/USD Pair
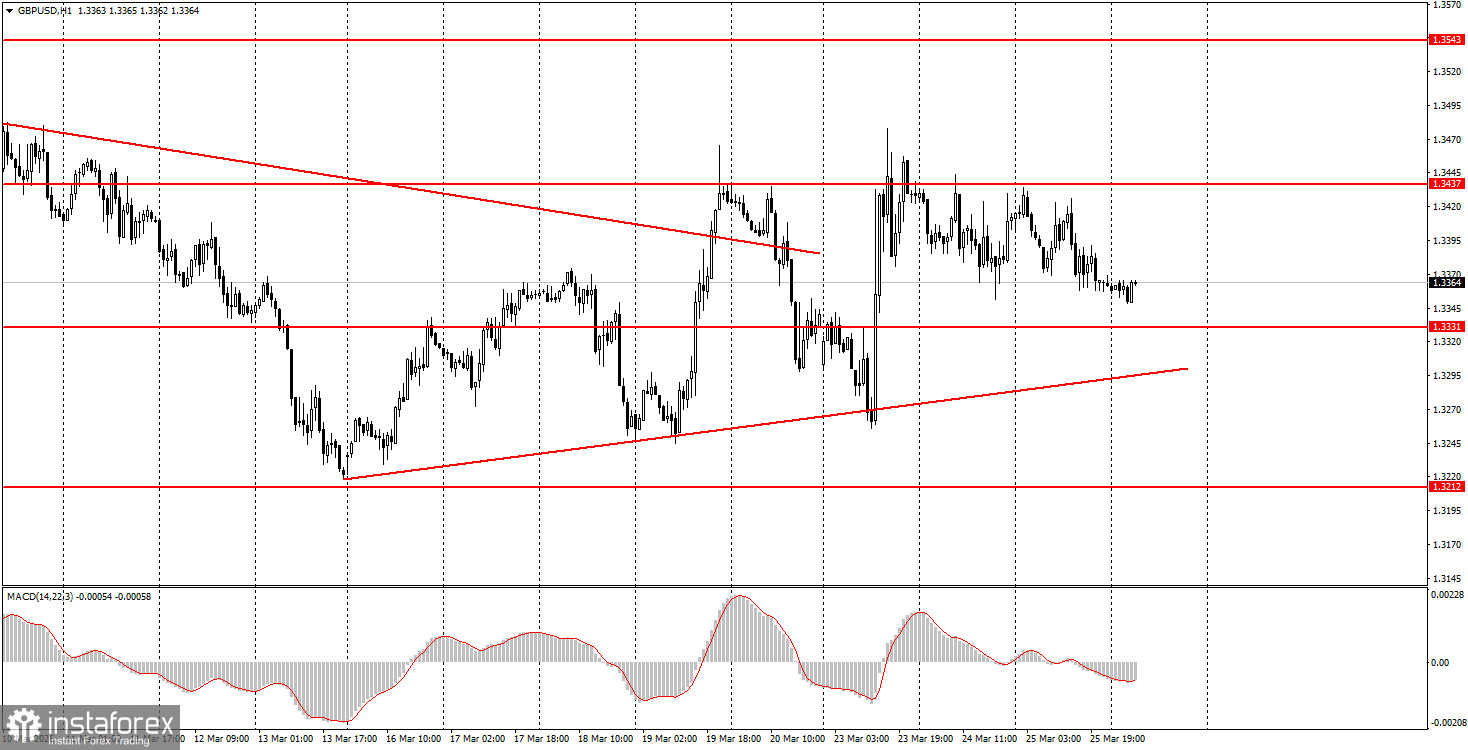
The GBP/USD pair also did not show any notable volatility on Wednesday, although, unlike in the EU or the US, an important report was published in the UK. However, as we warned, traders paid almost no attention to it. The consumer price index in Great Britain remained at 3% for February, while the core consumer price index rose to 3.2%. A slight acceleration in inflation ahead of a significant surge (in March). Nevertheless, traders could have reacted by buying the British pound, as any rise in inflation would bring the Bank of England closer to tightening monetary policy. But the market once again demonstrated that it is only interested in geopolitical news. The macroeconomic background continues to be ignored. Currently, there is no news regarding escalation or de-escalation, so the market is essentially stagnant.
5M Chart of the GBP/USD Pair
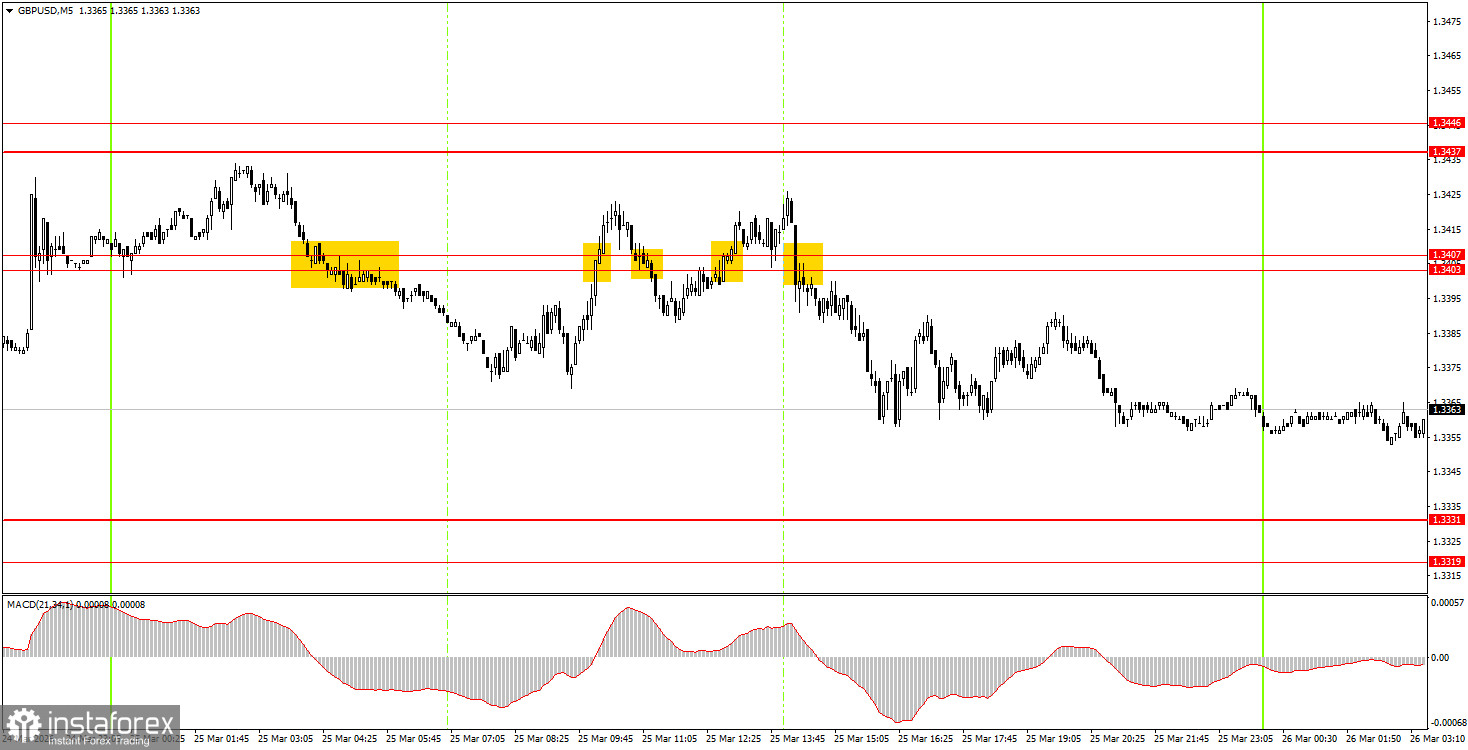
On the 5-minute timeframe, five trading signals were formed on Wednesday; however, the price constantly changed direction throughout the day, leading to the formation of false signals. On the hourly timeframe, there is currently no flat movement, nor a pronounced trend. This represents the most dangerous type of movement, as traders cannot trade like in a flat or in a trend. As a result, novice traders may have executed the first two signals in the 1.3403-1.3407 range, neither of which yielded a profit.
How to Trade on Thursday:
On the hourly timeframe, the GBP/USD pair has begun forming an upward trend, but this trend is very weak and uncertain. There are no global grounds for medium-term dollar growth, so in 2026, we expect a resumption of the global upward trend from 2025, which could bring the pair to at least 1.4000. However, for this to happen, geopolitical tensions worldwide need to start easing.
On Thursday, novice traders may open short positions if the price consolidates below the 1.3319-1.3331 area, with a target of 1.3259-1.3267. A bounce from the area of 1.3319-1.3331 will allow for the opening of long positions with a target of 1.3403-1.3407.
On the 5-minute timeframe, trading is currently possible at the levels of 1.3096-1.3107, 1.3203-1.3212, 1.3259-1.3267, 1.3319-1.3331, 1.3403-1.3407, 1.3437-1.3446, 1.3484-1.3489, 1.3529-1.3543, 1.3643-1.3652, 1.3695, 1.3741-1.3751. Today, there are no significant events or reports scheduled in the UK or the US, so the market's attention will once again be fully focused on geopolitics. If no significant news on this topic emerges, strange, low-volatility movements may be observed throughout the day.
Key Principles of the Trading System:
- The strength of a signal is determined by the time it takes to form the signal (bounce or breakout). The less time taken, the stronger the signal.
- If two or more trades have been opened at a particular level based on false signals, all subsequent signals from that level should be ignored.
- In a flat market, any pair can form many false signals or none at all. In any case, at the first signs of a flat trend, it is best to stop trading.
- Trading deals are to be opened during the period between the start of the European session and the mid-American session, after which all trades should be closed manually.
- On the hourly timeframe, it is preferable to trade based on signals from the MACD indicator only when there is good volatility and a trend confirmed by a trend line or trend channel.
- If two levels are positioned too close together (5-20 pips apart), they should be considered a support or resistance area.
- Upon moving 20 pips in the correct direction, a Stop Loss should be set to breakeven.
What to Look for on the Charts:
Price levels of support and resistance are levels that serve as targets when opening buys or sells. Take Profit levels can be placed around them.
Red lines represent channels or trend lines that show the current trend and indicate the direction in which it is preferable to trade now.
The MACD indicator (14,22,3) – the histogram and the signal line – is a supporting indicator that can also be used as a source of signals.
Important speeches and reports (always included in the news calendar) can significantly affect the movement of the currency pair. Therefore, during their release, trading should be done with utmost caution, or traders should exit the market to avoid sharp price reversals against the previous movement.
Beginning traders in the forex market should remember that not every trade can be profitable. Developing a clear strategy and effective money management are the keys to long-term trading success.