 English
  Русский
 Bahasa Indonesia
 Bahasa Malay
 ไทย
ไทย Español
 Deutsch
 Български
 Français
 Tiếng Việt
 中文
中文 বাংলা
বাংলা हिन्दी
 Čeština
 Українська
 Română

Analysis of Friday's Trades:
1H Chart of the EUR/USD Pair
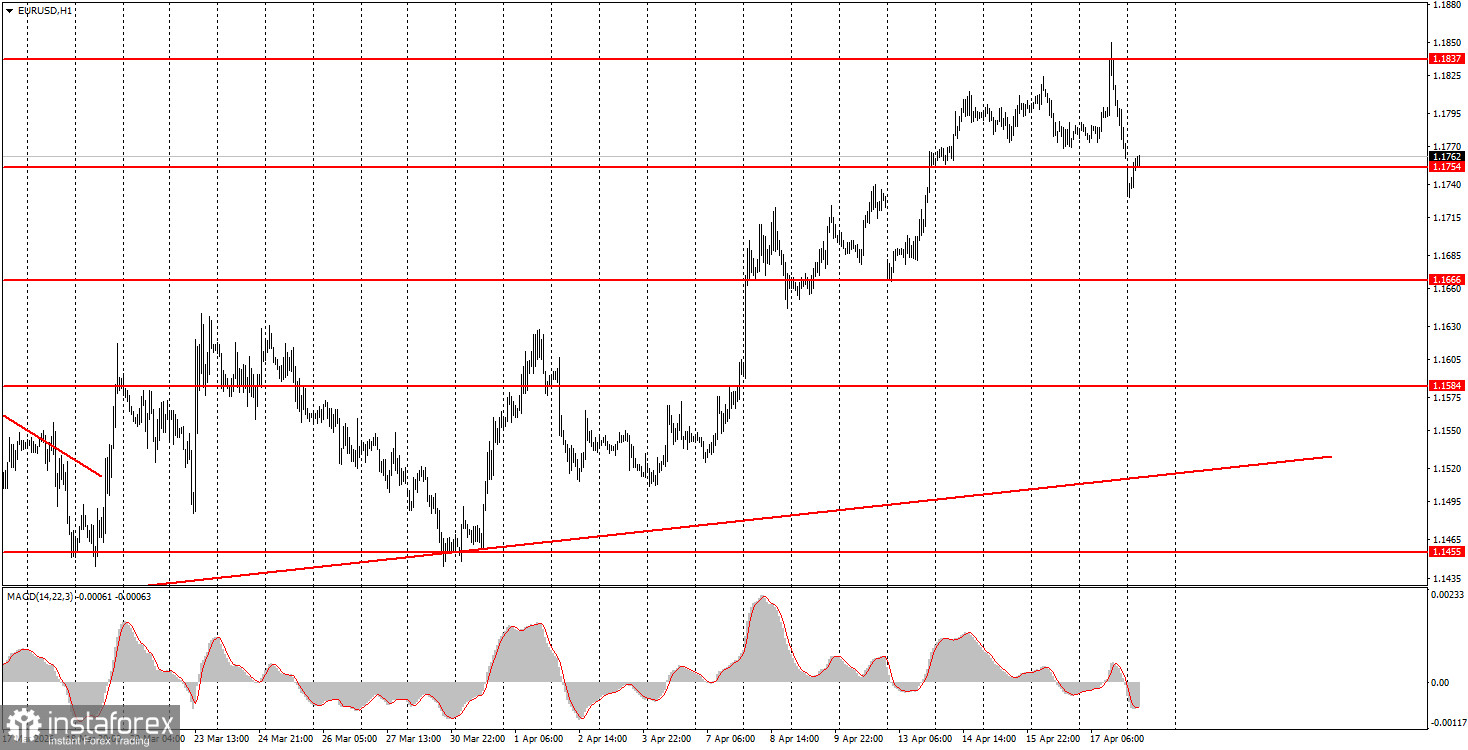
The EUR/USD currency pair unexpectedly plunged during the American trading session on Friday, despite Trump's statements about the opening of the Strait of Hormuz and reaching agreements with Iran. The Strait of Hormuz was indeed open for a short time, but by Friday evening, it was not known whether it would be closed again on Saturday. Therefore, selling the EUR/USD pair seemed strange. Over the weekend, even more negative news came in. Iran confirmed the renewed blockage of the strait, as the US did not fulfill its part of the deal and did not lift the blockade of Iranian ports. The negotiations did not take place, and the two-week ceasefire deadline will expire on Wednesday. As expected, Trump again threatened Iran with the destruction of its entire electrical infrastructure and bridges if the agreement was not signed. Thus, this week, the war in the Middle East may resume. Of course, we would like to avoid this, but the chances of an agreement are minimal. Rumors suggest that negotiations might still take place today, on Monday.
5M Chart of the EUR/USD Pair
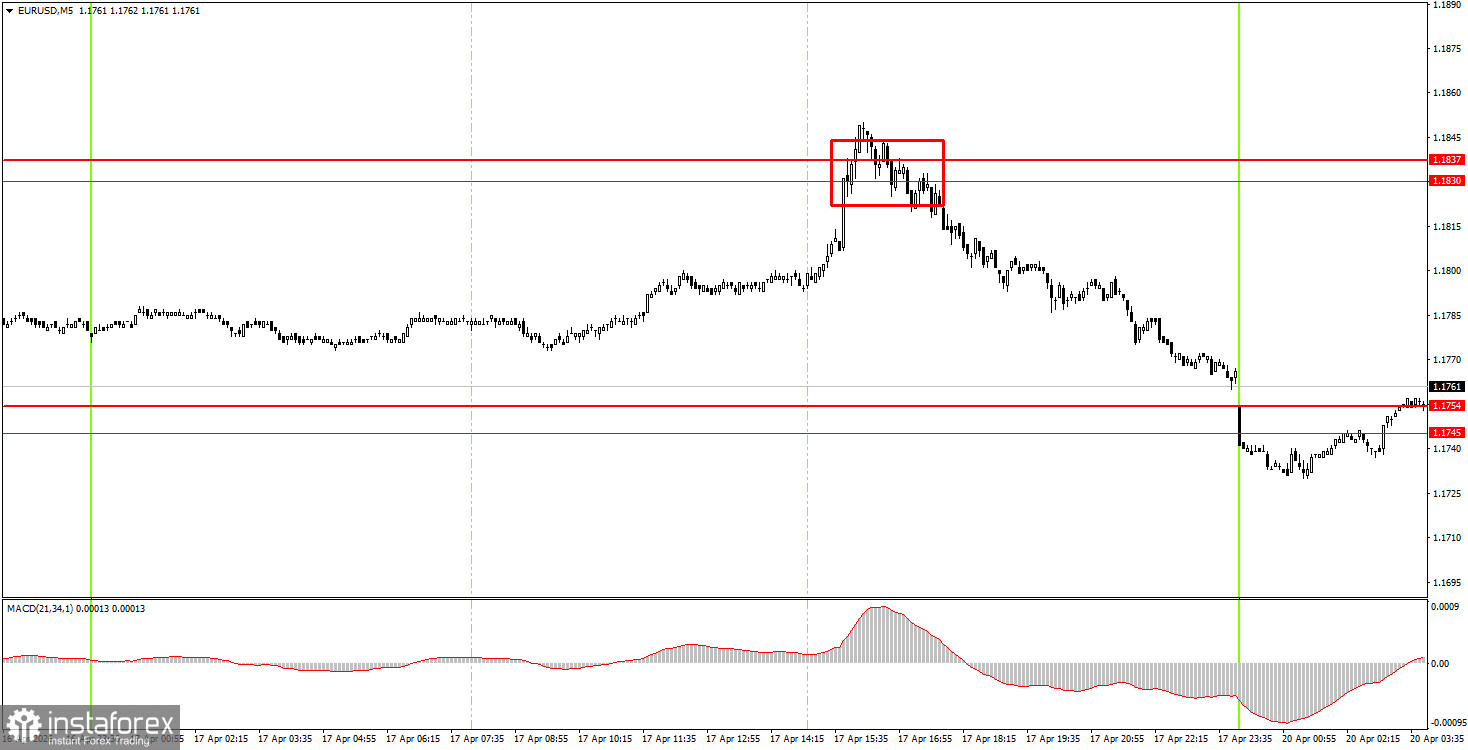
On the 5-minute timeframe, only one trading signal was formed on Friday – a sell signal. While not very precise, the price bounced from the 1.1830-1.1837 area during the American trading session, prompting a strong decline and hitting the 1.1745-1.1754 area. As a result, beginner traders could have earned about 50 pips on a single trade.
How to Trade on Monday:
The upward trend remains on the hourly timeframe. For two consecutive weeks, the market was selling off the dollar, and geopolitical factors had somewhat receded. However, geopolitics is worsening again, which could drive demand for the US dollar as a safe asset this week. We believe a correction is possible this week, but in any case, traders have technical levels to trade, and movements will depend on developments in the Middle East.
On Monday, beginner traders could consider short positions if the price settles below the 1.1745-1.1754 area, targeting 1.1655-1.1666. New buy trades could be considered upon a bounce from the area of 1.1745-1.1754, targeting 1.1830-1.1837.
On the 5-minute timeframe, key levels to watch include 1.1354-1.1363, 1.1413, 1.1455-1.1474, 1.1527-1.1531, 1.1584-1.1591, 1.1655-1.1666, 1.1745-1.1754, 1.1830-1.1837, 1.1899-1.1908. On Monday, European Central Bank President Christine Lagarde will give a speech, which is the only event of the day. The head of the ECB could theoretically reveal important information, but it seems that the central bank will continue to monitor the situation in the Middle East and will not rush to conclusions.
Key Principles of the Trading System:
- The strength of the signal is determined by the time it took to form the signal (bounce or level breakthrough). The shorter the time, the stronger the signal.
- If two or more trades were opened around any level based on false signals, all subsequent signals from that level should be ignored.
- In a range, any pair can generate a lot of false signals or may not generate them at all. Technical levels may be ignored.
- On the hourly timeframe, it is advisable to trade MACD signals only when volatility is good, and the trend is confirmed by a trendline or trend channel.
- If two levels are located too close together (5-20 pips apart), they should be considered a support or resistance area.
- After moving 15 pips in the correct direction, a Stop Loss should be set to breakeven.
What to Look for on the Charts:
Price levels of support and resistance are levels that serve as targets when opening buys or sells. Take Profit levels can be placed around them.
Red lines represent channels or trend lines that show the current trend and indicate the direction in which it is preferable to trade now.
The MACD indicator (14,22,3) – the histogram and the signal line – is a supporting indicator that can also be used as a source of signals.
Important speeches and reports (always included in the news calendar) can significantly affect the movement of the currency pair. Therefore, during their release, trading should be done with utmost caution, or traders should exit the market to avoid sharp price reversals against the previous movement.
Beginning traders in the forex market should remember that not every trade can be profitable. Developing a clear strategy and effective money management are the keys to long-term trading success.