 English
  Русский
 Bahasa Indonesia
 Bahasa Malay
 ไทย
ไทย Español
 Deutsch
 Български
 Français
 Tiếng Việt
 中文
中文 বাংলা
বাংলা हिन्दी
 Čeština
 Українська
 Română

Markets are behaving unusually, or even strangely. Before the pandemic, in 80% of cases, the S&P 500 would retest a recently formed low when it failed to move into "bear" territory. Since 2020,the broad equity index has abandoned that pattern entirely. It has been rising like yeast, and FOMO — Fear of Missing Out — prevents any meaningful pauses or retests. That is what is happening in April amid the apparent winding down of the geopolitical conflict in the Middle East, which, in reality, is not over.
Alongside the complete absence of double bottoms, investors may be alarmed by low trading volumes and narrow market breadth. When the S&P 500 hit its first record high since October, only 11 of the 500 stocks registered new 52-week highs. By the week ending April 17, that number had risen to 48.
S&P 500 and Equal Weight Index dynamics
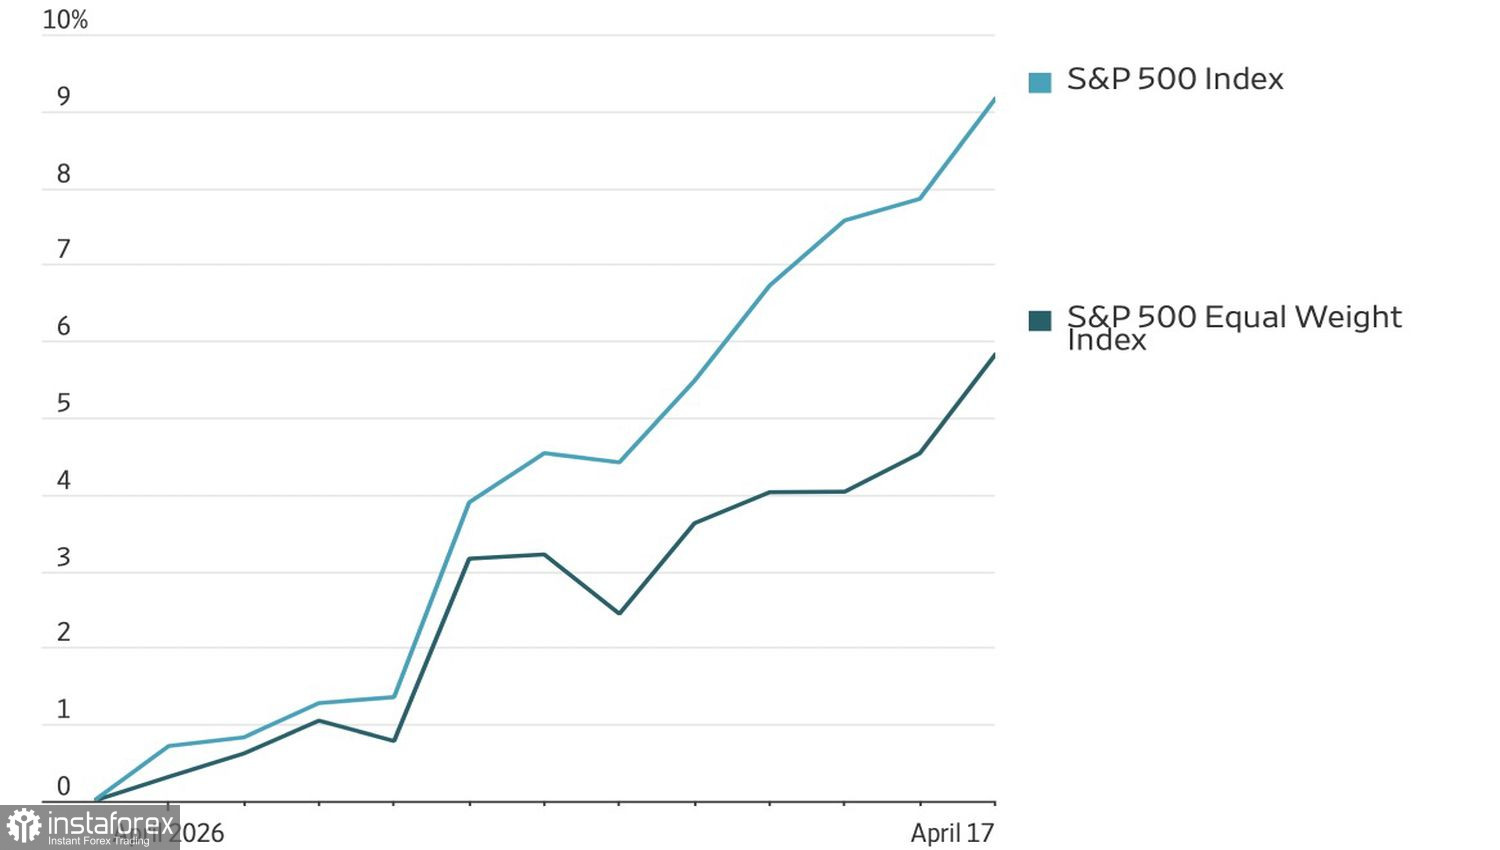
The April rally in the broad index has been powered by a handful of large-cap names, allowing the S&P 500 to significantly outperform its equal-weighted version. Today's market is far from the bullish tape of 2021, when about 90% of stocks traded above their 200-day moving average. Now that figure is closer to 60%.
That said, narrow breadth alone is not a reason to panic. Markets always have leaders — whether the Magnificent Seven or another group — and others tend to follow. There are still stocks to buy, so the odds that the S&P 500 rally continues are high enough to remain aligned with bulls.
Dynamics of S&P 500 stocks trading above 200-day EMA
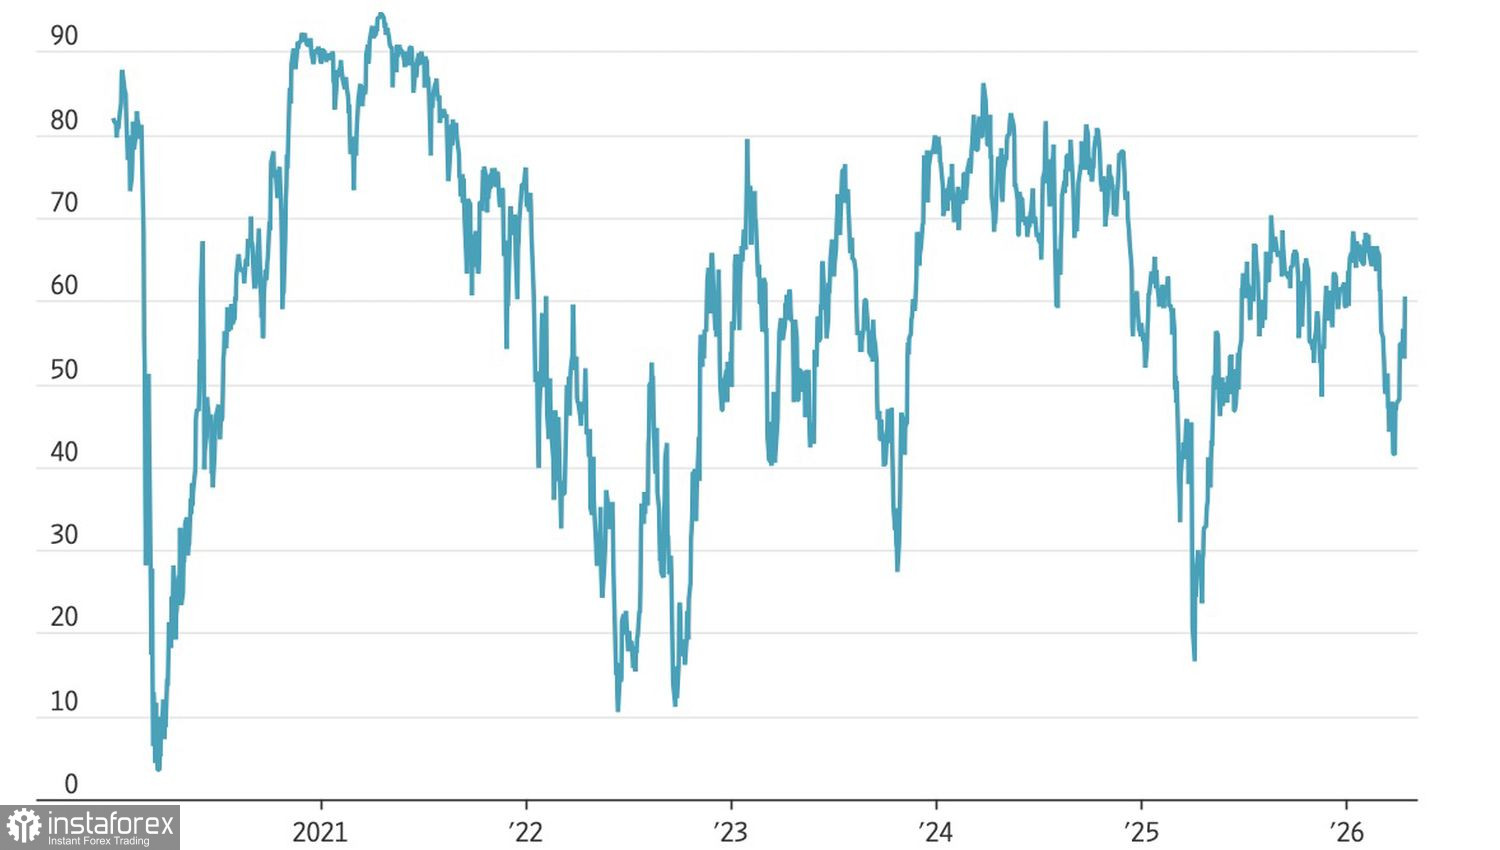
The same holds for US equity trading volumes. In April, they are about 11% below the six-month average. In March, amid a spike in Middle East tensions, volumes were roughly 9.5% above average. Given the S&P 500's drop over that period, it appears traders sold with more conviction in early spring than they are buying now in mid-spring.
In short, uncertainty exists, but as that uncertainty fades, trading volumes in US equities should rise, along with the army of bulls. Are new record highs for the S&P 500 just around the corner?
The answer will depend on developments in the Middle East. The ceasefire window is expiring, and Donald Trump sees an extension as unlikely. The US president has threatened renewed bombing if no deal with Iran is reached. At the same time, US-Iran negotiations are still likely to occur, and hopes for peace are keeping US equity bulls optimistic.
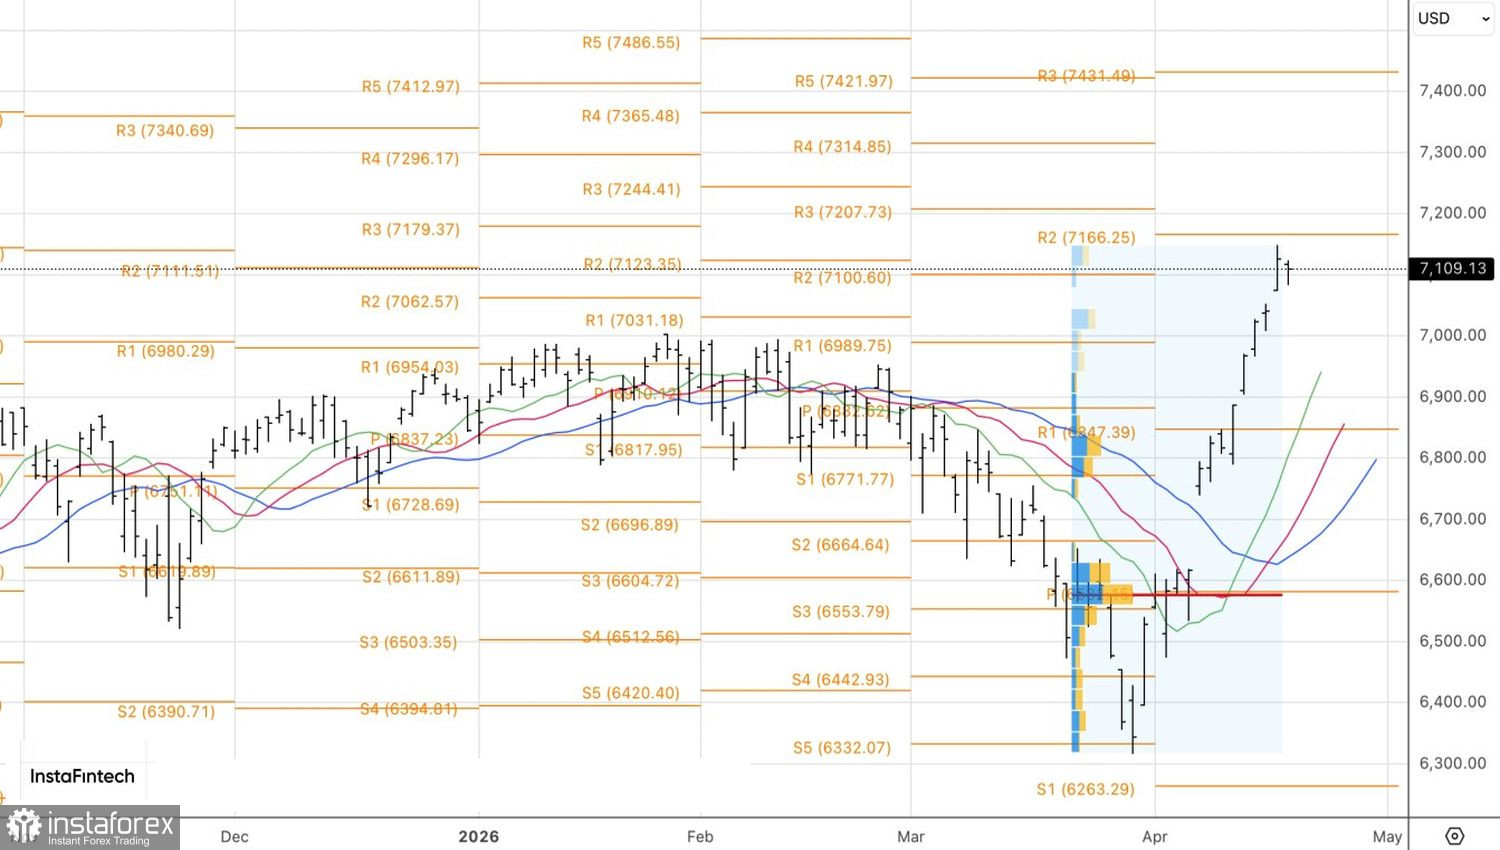
Technically, the daily chart shows that the S&P 500 has formed an inside bar. It can be played with pending orders: it would make sense to buy at 7,125 to add to existing long positions, or sell the broad index at 7,080.