 English
  Русский
 Bahasa Indonesia
 Bahasa Malay
 ไทย
ไทย Español
 Deutsch
 Български
 Français
 Tiếng Việt
 中文
中文 বাংলা
বাংলা हिन्दी
 Čeština
 Українська
 Română

According to Glassnode and Santiment data, there has been a significant spike in profit-taking among short?term Bitcoin holders. This metric, closely watched by many market participants, can signal turning points in the asset's price action. Short?term holders are traders who bought their BTC relatively recently and tend to sell at the first sign of sizable gains, fearing a potential correction.

The observed momentum toward taking profits suggests a sizable portion of these market participants have decided to lock in gains at current levels. This may be driven by various factors: from a desire to hedge short-term risks amid the possibility of renewed conflict in the Middle East to confidence that local price peaks have been reached. A surge in such selling can put downward pressure on price, especially if it occurs alongside weakening buying interest from longer-term investors. And that is precisely the problem: spot market buying continues to decline.
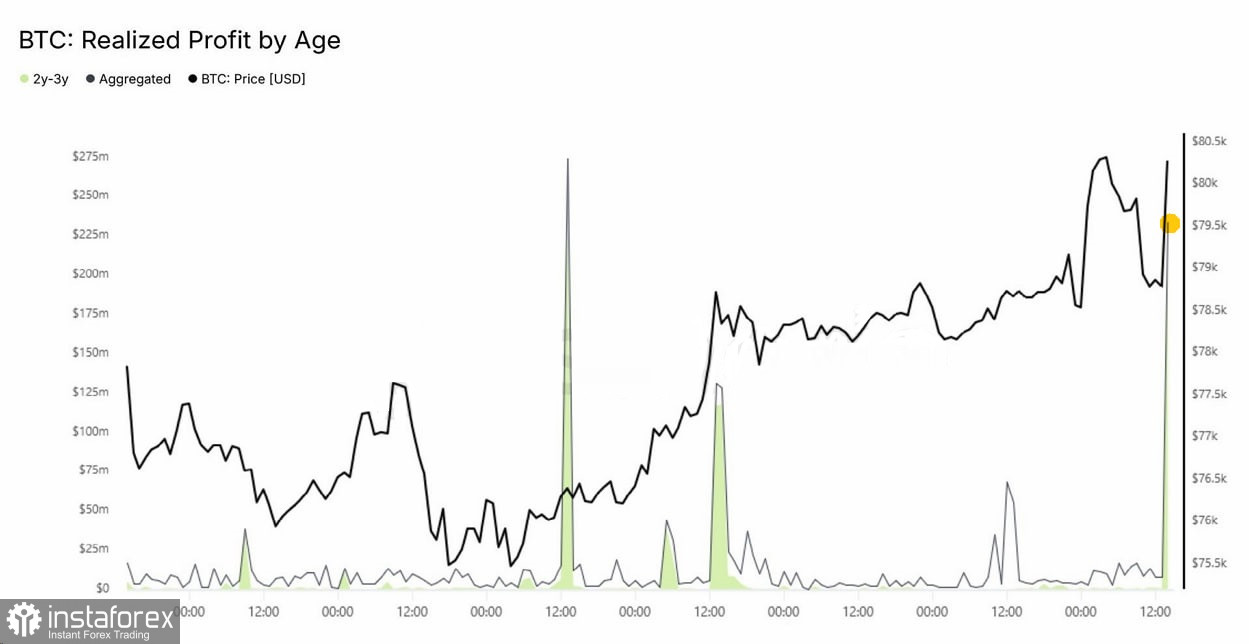
If other market participants — for example, long?term investors, who often have a deeper understanding of fundamentals — begin joining the short-term holders in selling, a substantial Bitcoin sell-off could occur. Much now depends on the geopolitical situation in the Middle East: if tensions escalate, pressure on the crypto market could return quickly.
Trading recommendations
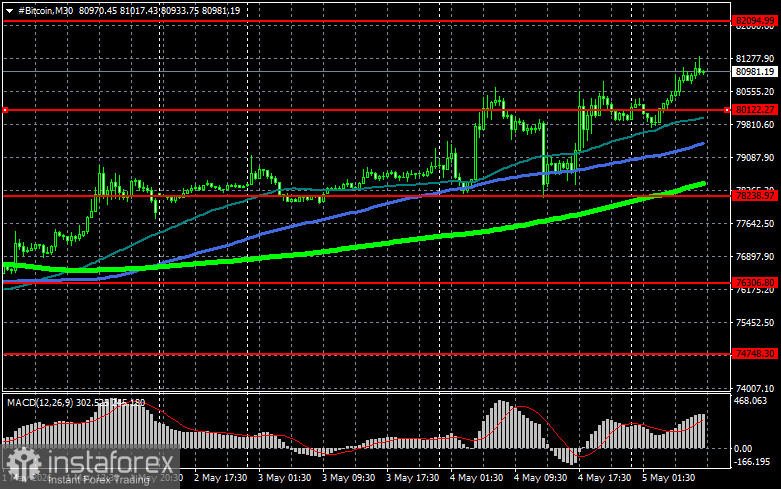
Bitcoin
Buyers are currently targeting a return to $82,000, which opens a direct path to $84,000, and then to $85,600. The far target is the high around $87,600; breaking that level would indicate attempts to resume a bull market. In case of a decline, buyers are expected at $80,100. A drop below that area could quickly push BTC toward $78,300, with the far downside target at around $76,300.
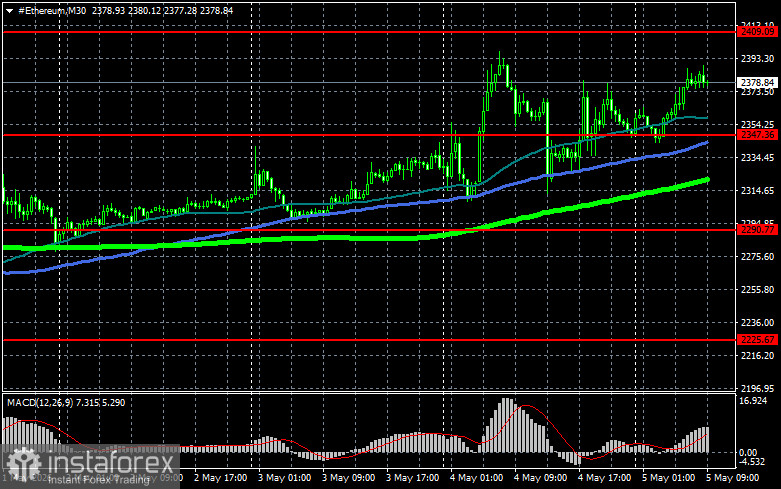
Ethereum
A clear hold above $2,409 opens a direct path to $2,492. The far target is the high near $2,575; breaking that would signal strengthening bullish sentiment and renewed buyer interest. In case of a decline, buyers are expected at $2,347. A fall below that area could quickly push ETH toward $2,290, with the far downside target around $2,225.
What's on the chart
- The red lines represent support and resistance levels, where the price is expected to either pause or react sharply.
- The green line shows the 50-day moving average.
- The blue line is the 100-day moving average.
- The lime line is the 200-day moving average.
Price testing or crossing any of these moving averages often either halts movement or injects fresh momentum into the market.