 English
  Русский
 Bahasa Indonesia
 Bahasa Malay
 ไทย
ไทย Español
 Deutsch
 Български
 Français
 Tiếng Việt
 中文
中文 বাংলা
বাংলা हिन्दी
 Čeština
 Українська
 Română

EUR/USD Analysis 5M
The EUR/USD currency pair continued its downward movement on Friday, although there were few strong reasons for this. However, the market has remained focused on the escalation of the conflict in the Middle East, with trading driven by this factor throughout the past week. After the announcement of yet another failure in negotiations between Iran and the US last Monday, no further information has been received. In other words, negotiations between Tehran and Washington are currently on pause, and the conflicting parties continue to threaten each other. However, is a whole week of the US currency's growth justified by an event that has not yet happened? The market often prices in many events in advance, so the rise of the dollar does not surprise us. But how much longer does the market intend to buy US currency? What if the conflict does not resume?
From a technical perspective, a new downward trend has formed, but it lacks a trend line as there are not two price extremes to define it. Thus, traders will have to rely solely on the Senkou Span B lines. Given that the pair's decline last week was 80% "geopolitical," any reversal of this factor (which could happen at any moment) will turn the market against the US dollar.
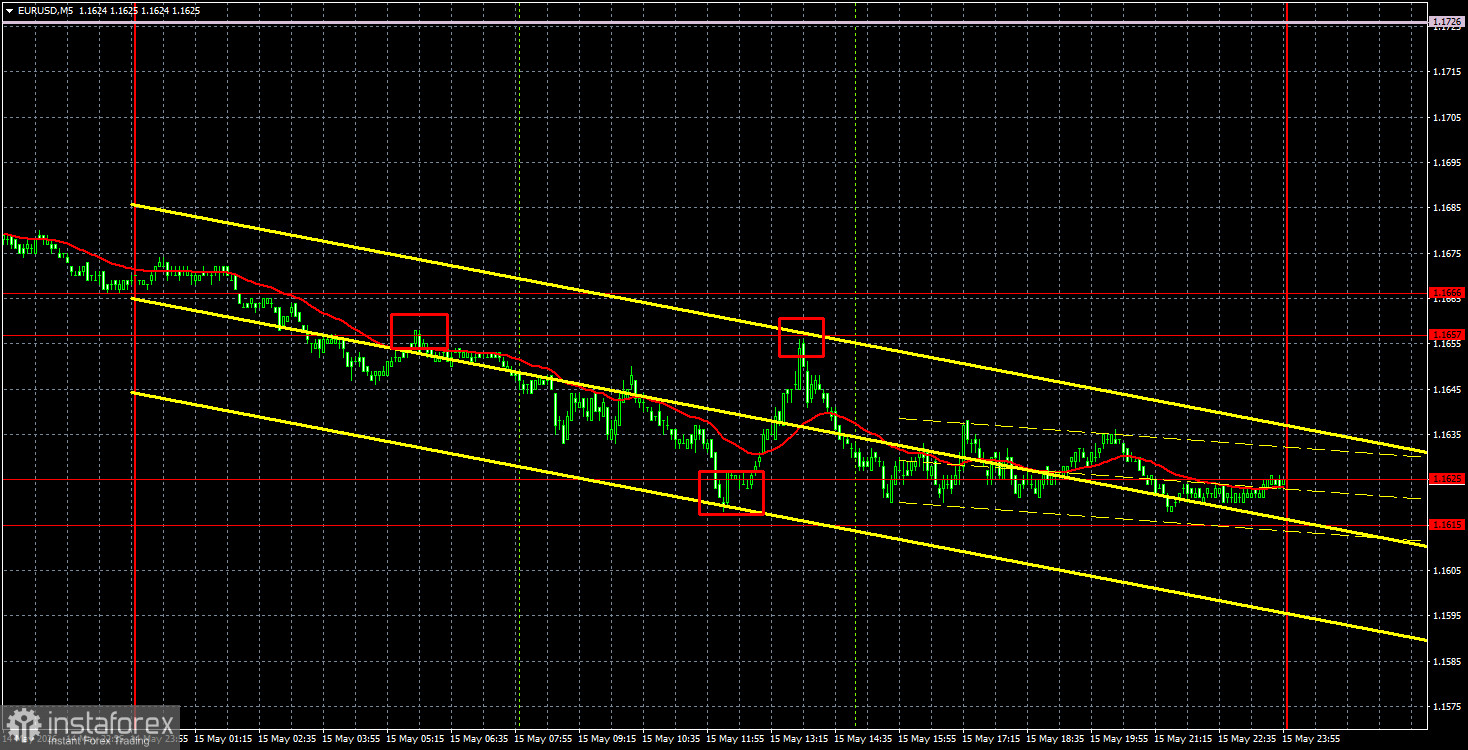
On the 5-minute timeframe on Friday, three ideal trading signals were formed. Before the opening of the European trading session, the pair bounced off the area of 1.1657-1.1666, then dropped to the area of 1.1615-1.1625, rebounding from it, and finally returned to the area of 1.1657-1.1666, bouncing off it again. Thus, traders could have opened three trades on Friday, and in all three cases, the target areas were reached.
EUR/USD Analysis 4H
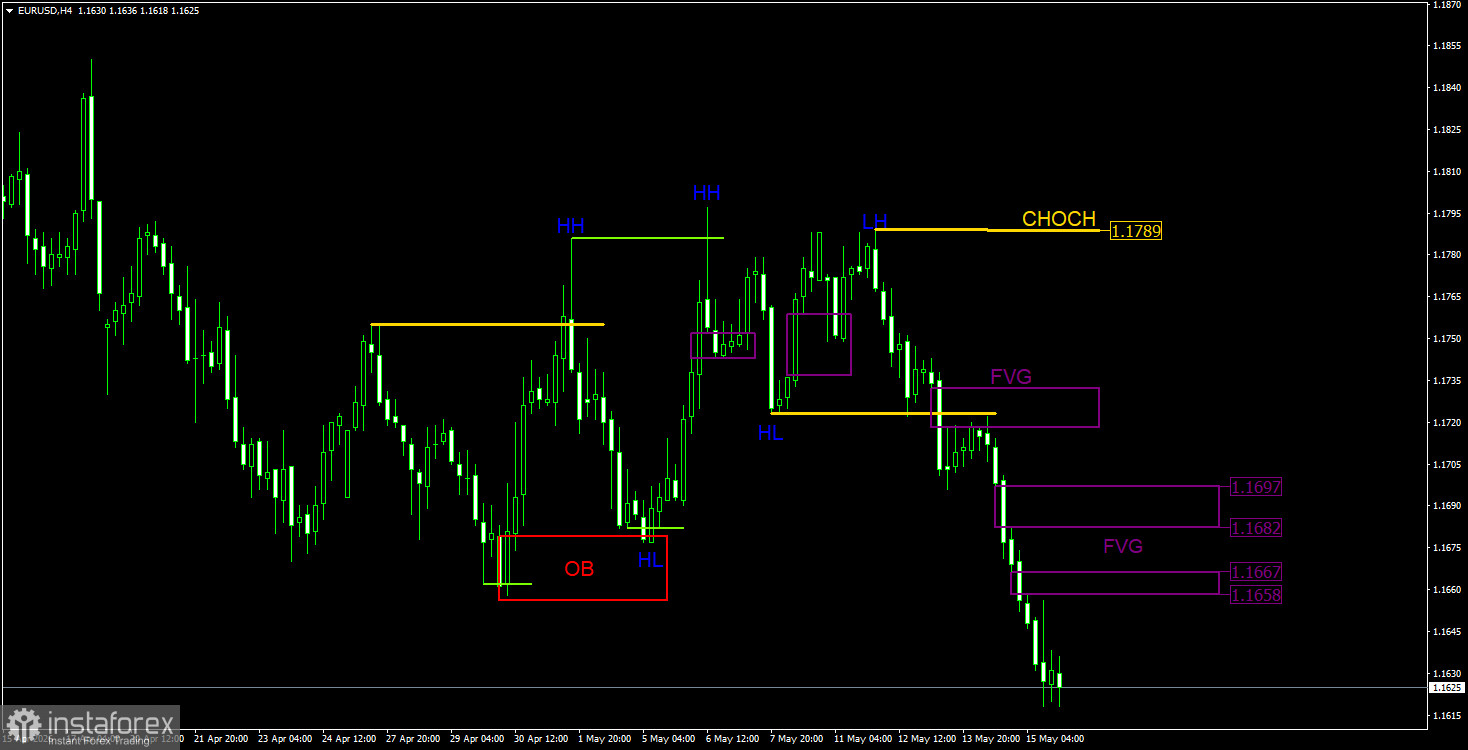
On the 4-hour timeframe, according to the ICT trading system, the situation was favorable for traders on Friday. An upward trend was broken, and a bearish FVG pattern formed in the 1.1718-1.1732 area, followed by a clear sell signal there, as we had warned earlier. Therefore, traders could simply remain in the previously opened short positions from a clear area of POI and in line with the trend. New bearish FVGs were also formed on Friday, which may lead to new sell signals on Monday. The most important FVG is the nearest one—located in the area of 1.1658-1.1667—which almost coincides with the resistance area on the hourly timeframe.
EUR/USD Analysis 1H
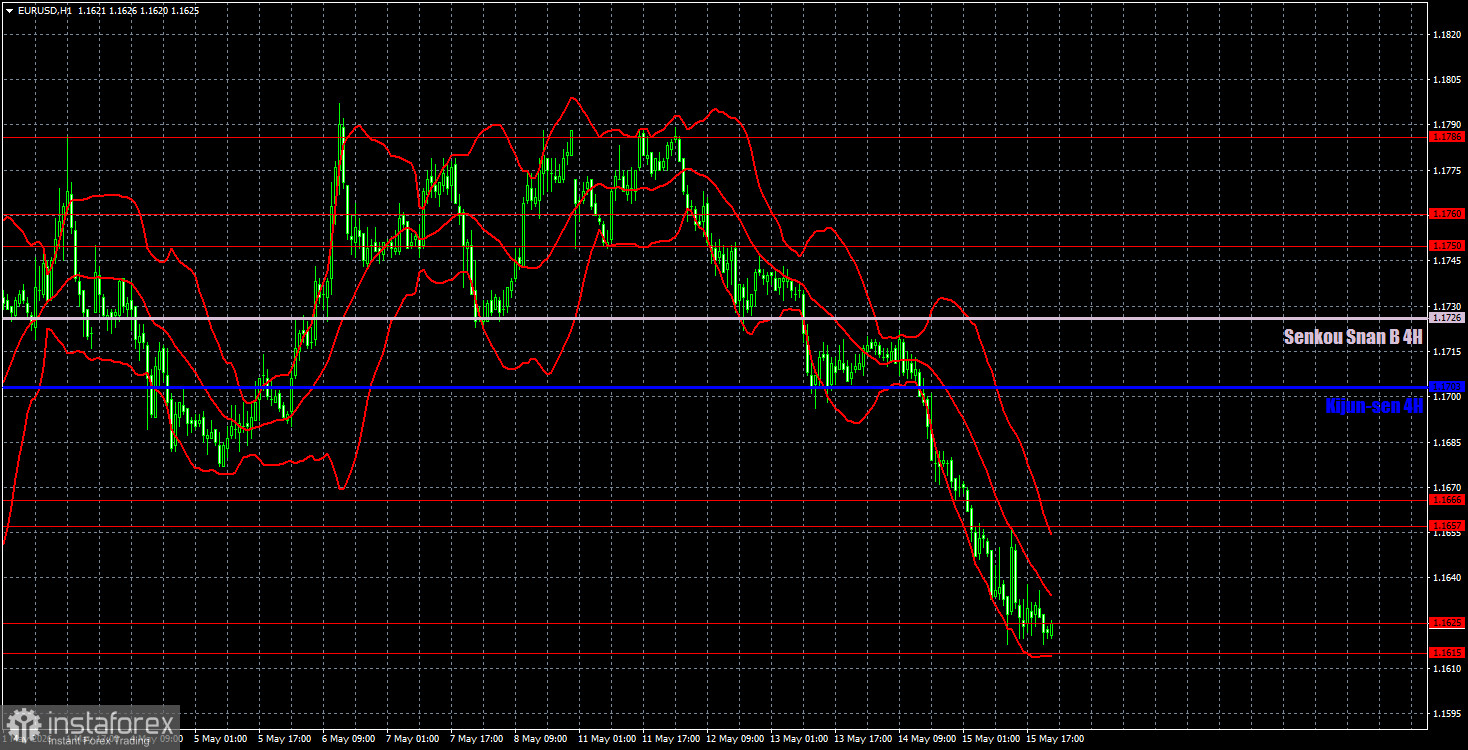
On the hourly timeframe, the EUR/USD pair continues to form a new downward trend. The situation in the Middle East remains tense, with no improvement, but negotiations have again stalled, allowing the dollar to show restrained growth. In the near future, the pair's movements will depend on geopolitics. If there are no new signs of escalation in the Middle East, the dollar will begin to lose ground.
For May 18, we highlight the following trading levels—1.1362, 1.1426, 1.1542, 1.1615-1.1625, 1.1657-1.1666, 1.1750-1.1760, 1.1786, 1.1830-1.1837, 1.1907-1.1922—as well as the Senkou Span B line (1.1726) and Kijun-sen (1.1703). The Ichimoku indicator lines may shift throughout the day, so this should be accounted for when determining trading signals. Don't forget to set the stop-loss order to breakeven if the price moves in the correct direction by 15 pips. This will protect against potential losses if the signal turns out to be false.
On Monday, there are no important events scheduled in either the European Union or the US; therefore, traders can only hope for news from Iran or the White House. We do not believe that the US currency will continue to strengthen without negative news regarding the Iran-US confrontation.
Trading Recommendations:
Today, traders may open new short positions targeting 1.1542 if the price consolidates below the 1.1615-1.1625 area. Long positions can be opened in case of a price bounce from the area of 1.1615-1.1625, with targets at 1.1657-1.1666 and 1.1703. On the 4-hour timeframe, to open new sell positions, traders should wait for signals in the bearish FVG.
Explanations for the Illustrations:
- Price levels of support and resistance – thick red lines where the movement may end. These do not serve as sources of trading signals.
- Kijun-sen and Senkou Span B lines – Ichimoku indicator lines transferred from the 4-hour to the hourly timeframe. These are strong lines.
- Extremum levels – thin red lines where the price previously bounced. These serve as sources of trading signals.
- Yellow lines – trendlines, trend channels, and any other technical patterns.
- CHOCH – change of trend structure.
- Liquidity – Stop Loss, pending orders that market makers use to build their positions.
- FVG – Fair Value Gap. Price moves very quickly through these areas, indicating a complete absence of one side in the market. Subsequently, the price tends to return and react to such areas in continuation of the main trend.
- IFVG – Inverted Fair Value Gap. After returning to such an area, the price does not react to it; it breaks impulsively and then tests it from the other side.
- OB – Order Block. The candle on which a market maker opened a position with the aim of gathering liquidity to form their position in the opposite direction.