 English
  Русский
 Bahasa Indonesia
 Bahasa Malay
 ไทย
ไทย Español
 Deutsch
 Български
 Français
 Tiếng Việt
 中文
中文 বাংলা
বাংলা हिन्दी
 Čeština
 Українська
 Română

EUR/USD 5M Analysis
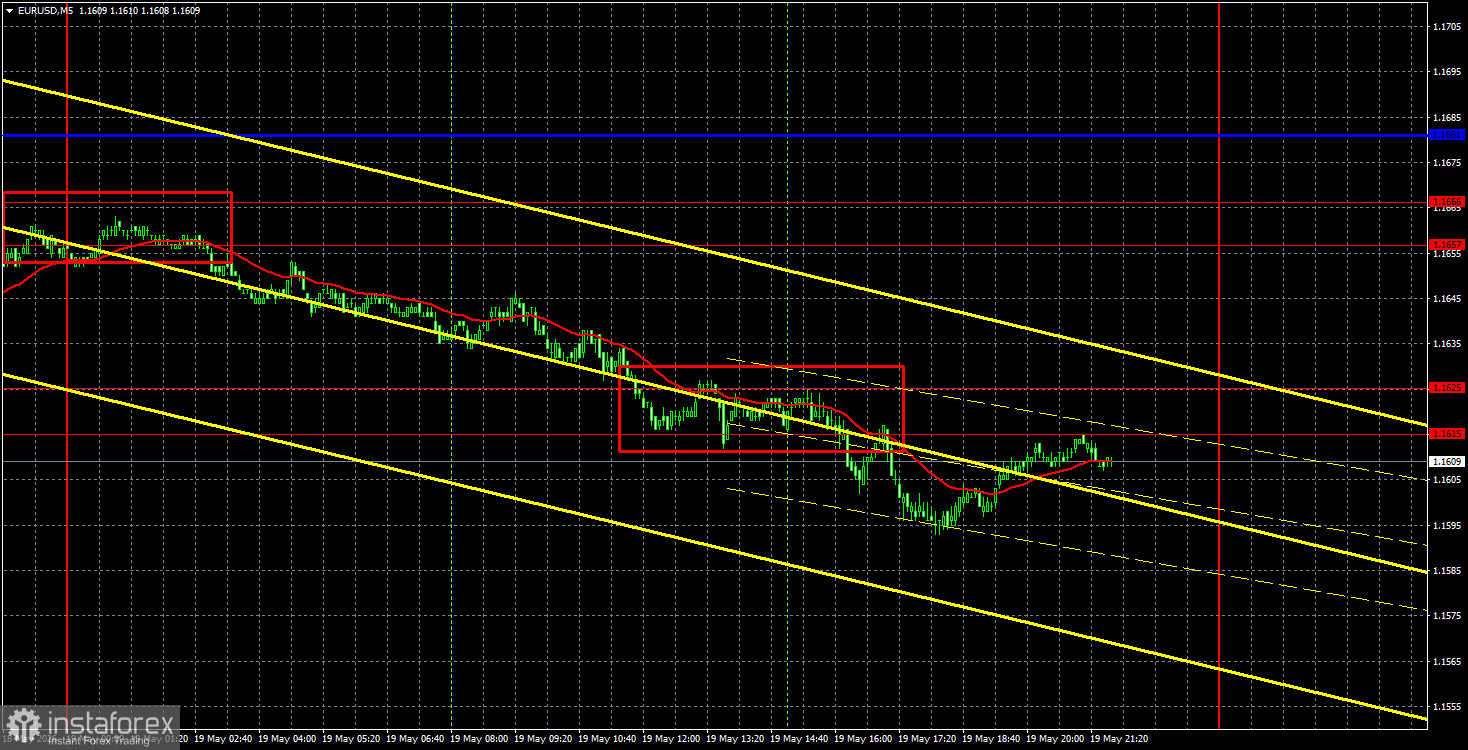
The EUR/USD currency pair resumed its downward movement on Tuesday after failing to overcome the 1.1657-1.1666 area or the critical Kijun-sen line. Therefore, from a technical standpoint, everything is proceeding as planned. Regarding other factors, the key issue remains geopolitics, which continues to exert pressure on risk assets and currencies. The problem is that an enormous amount of conflicting information comes in daily, yet the market no longer believes optimistic proclamations about the progress of negotiations or the imminent resolution of the conflict. No confirmed information has emerged regarding what the parties are currently negotiating, who is involved in the talks, and what concessions the participants are willing to make to satisfy the interests of all parties. Consequently, traders are left to guess. The movements of the EUR/USD pair over the past two weeks clearly indicate the market's positioning.
Technically, the downward trend persists, but if Iran and the U.S. resume negotiations this week, the dollar could drop as rapidly as it has risen. Regrettably, geopolitics is once again dictating much of the movements in the currency market.
On the 5-minute timeframe on Tuesday, two trading signals were generated. Earlier in the Asian trading session, the pair bounced off the 1.1657-1.1666 area, and in the European session, it reached the 1.1615-1.1626 target area. During the American session, another sell signal was generated by breaking through the 1.1615-1.1625 area. Thus, traders could open at least one trading position.
EUR/USD Analysis 4H
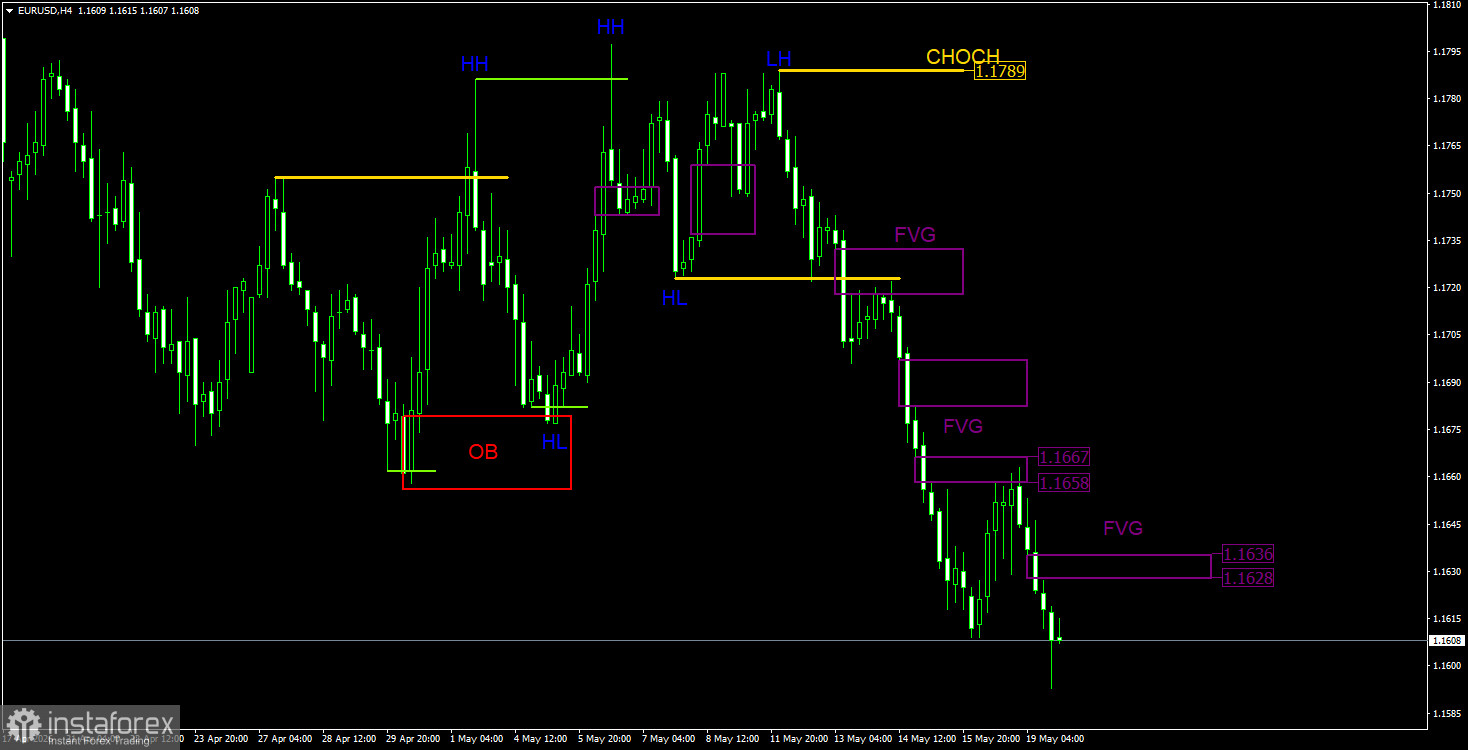
On the 4-hour timeframe, the situation in the ICT trading system was highly favorable for traders on Monday. On that day, the price managed to work through the nearest area of POI for sales — the "bearish" FVG of 1.1658-1.1667. Furthermore, during the night on Tuesday, a signal formed in this area, and throughout the day, the price declined. Thus, the signal worked perfectly.
On Tuesday, another bearish FVG was created, which can also be used as a POI. It's important to remember that in this area, a confirmation signal should form on the timeframe two levels below the current one, rather than simply the price reaching it.
EUR/USD Analysis 1H
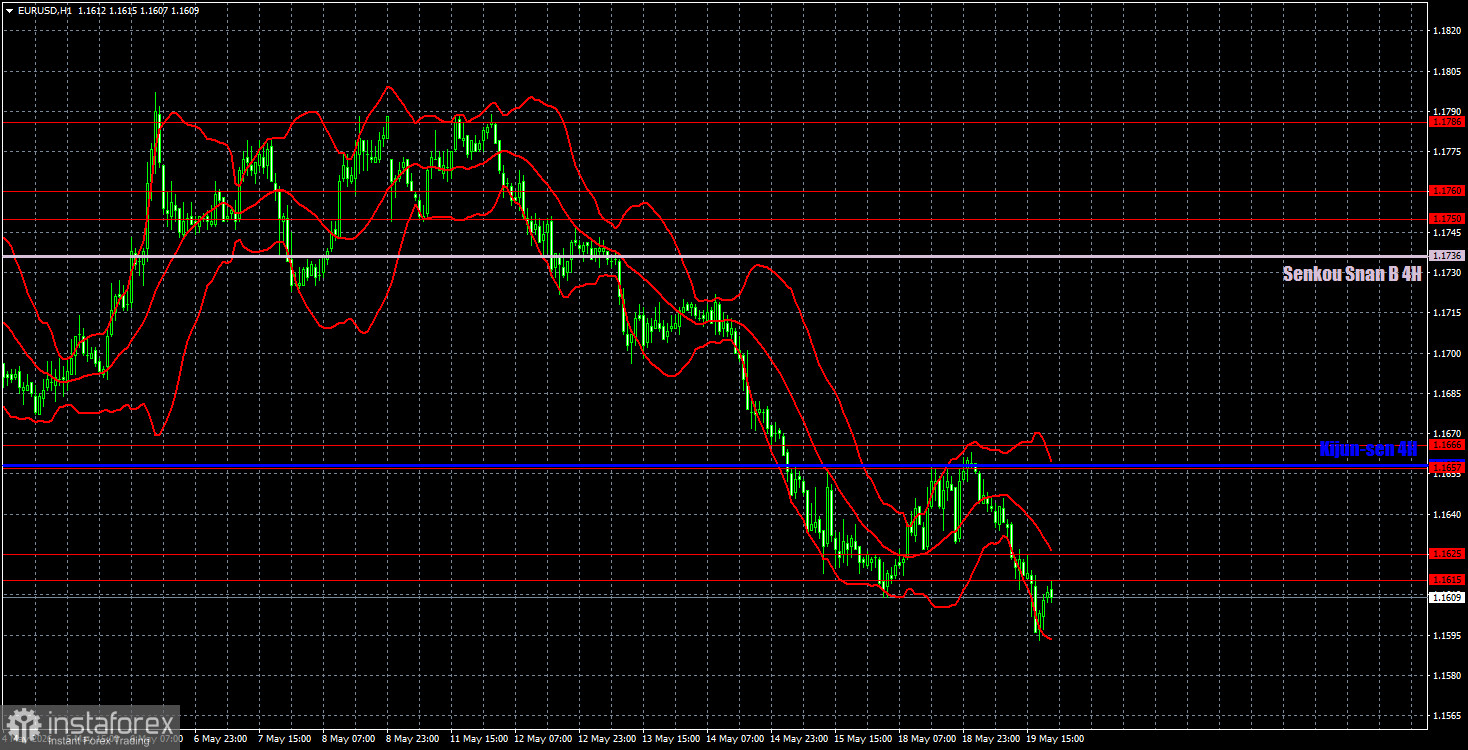
On the hourly timeframe, the EUR/USD pair continues to form a new downward trend. The situation in the Middle East remains tense; it hasn't worsened, but negotiations have hit another deadlock, allowing the dollar to show moderate growth. In the near term, price movements will depend on geopolitical factors. If no new signs of escalation in the Middle East emerge, the dollar will begin to lose ground.
For May 20, we highlight the following trading levels: 1.1362, 1.1426, 1.1542, 1.1615-1.1625, 1.1657-1.1666, 1.1750-1.1760, 1.1786, 1.1830-1.1837, 1.1907-1.1922, as well as the Senkou Span B line (1.1736) and the Kijun-sen line (1.1658). It should be noted that the Ichimoku indicator lines can move throughout the day, which should be considered when determining trading signals. Don't forget to set a Stop Loss order to break even if the price moves in the right direction by 15 pips. This will protect against potential losses if the signal turns out to be false.
On Wednesday, the second estimate of April inflation for the Eurozone will be released, and the minutes from the last FOMC meeting will be published in the U.S. We consider both events to be relatively minor. Geopolitics will once again define market dynamics.
Trading Recommendations:
Today, traders may open new short positions targeting 1.1542 upon a price retracement from the area of 1.1615-1.1625. Long positions can be opened if the price consolidates above the 1.1615-1.1625 area, with a target of 1.1657-1.1666. On the 4-hour timeframe, a signal in the bearish FVG of 1.1628-1.1636 is required to open new short positions.
Explanations for the Illustrations:
- Price levels of support and resistance – thick red lines where the movement may end. These do not serve as sources of trading signals.
- Kijun-sen and Senkou Span B lines – Ichimoku indicator lines transferred from the 4-hour to the hourly timeframe. These are strong lines.
- Extremum levels – thin red lines where the price previously bounced. These serve as sources of trading signals.
- Yellow lines – trendlines, trend channels, and any other technical patterns.
- CHOCH – change of trend structure.
- Liquidity – Stop Loss, pending orders that market makers use to build their positions.
- FVG – Fair Value Gap. Price moves very quickly through these areas, indicating a complete absence of one side in the market. Subsequently, the price tends to return and react to such areas in continuation of the main trend.
- IFVG – Inverted Fair Value Gap. After returning to such an area, the price does not react to it; it breaks impulsively and then tests it from the other side.
- OB – Order Block. The candle on which a market maker opened a position with the aim of gathering liquidity to form their position in the opposite direction.