 English
 Русский
 Bahasa Indonesia
 Bahasa Malay
 ไทย
ไทย Español
 Deutsch
 Български
 Français
 Tiếng Việt
 中文
中文 বাংলা
বাংলা हिन्दी
 Čeština
 Українська
 Română


Analysis of GBP/USD 5M
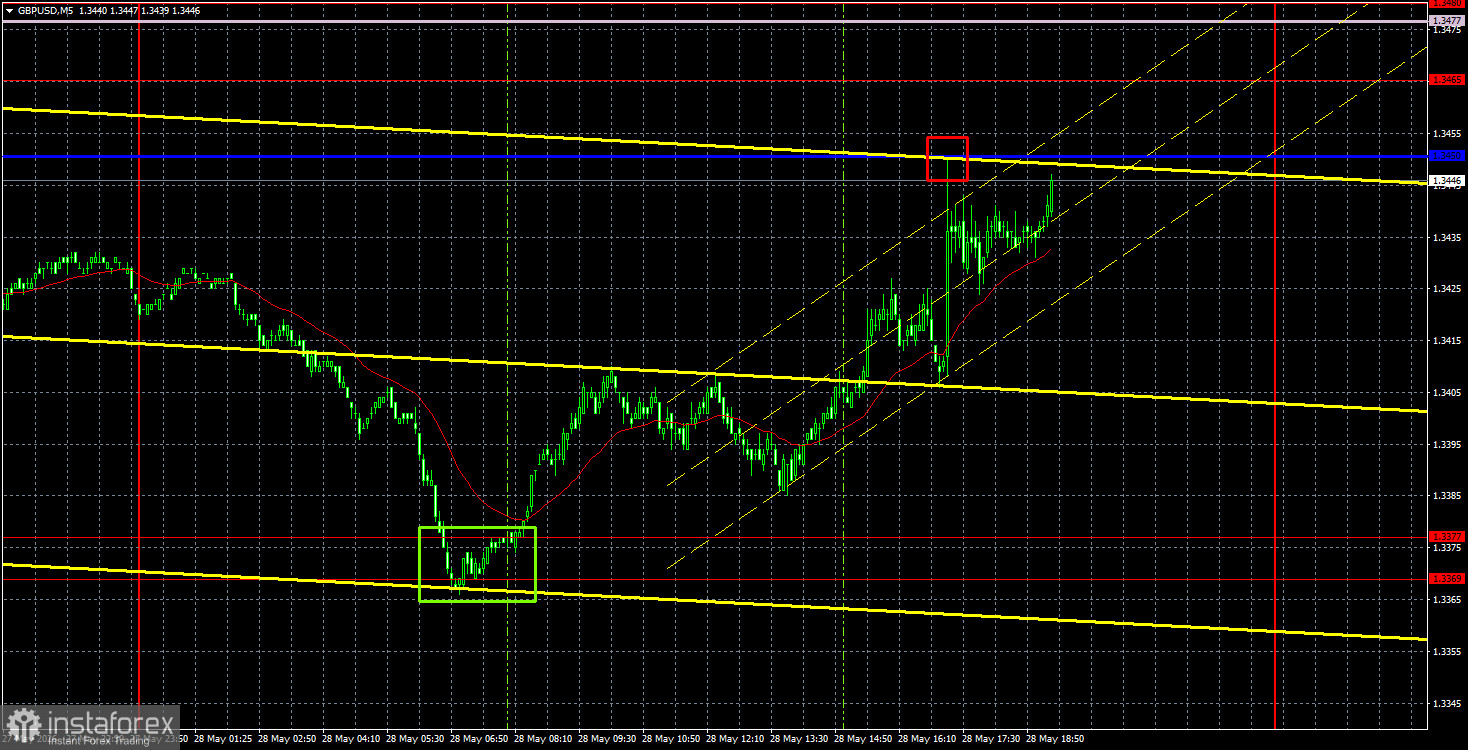
The GBP/USD currency pair attempted to extend its downward movement on Wednesday, but the effort was unsuccessful once again. The day for the dollar began very positively, as Iran and the U.S. exchanged fire again near the Strait of Hormuz, and Donald Trump threatened Oman with military action if it reached a deal with Iran regarding control of the strait. The geopolitical situation in the Middle East tightened again, prompting a rise in the dollar. However, in the second half of the day, a decent PCE index and durable goods orders from the U.S. were released, which could have supported further growth of the American currency. If not for one caveat... The U.S. GDP for the first quarter was revised downward in the second estimate, which was lower than the initial estimate and below forecasts. Following this report, the U.S. dollar fell as the market again anticipated a recession for the American economy. Moreover, stagflation concerns loom because the Federal Reserve cannot raise rates.
From a technical standpoint, the upward trend has concluded on the hourly timeframe, so we may see the pair decline this week. The price has breached the trendline. Without geopolitical support, it will be challenging for the British currency to demonstrate growth in the near term, and macroeconomic and fundamental factors are generally being ignored by the market, with few exceptions. In the near future, the dynamics of the British pound will depend not on technical analysis but on geopolitical events. The market is once again bracing for the worst and preparing for it.
On the 5-minute timeframe on Thursday, two excellent trading signals formed, unlike on Wednesday. At the very beginning of the European trading session, the price bounced from the area of 1.3369-1.3377, and by the end of the day, it worked through the Kijun-sen line. Thus, traders could have opened at least one long position, resulting in a profit of at least 55 pips.
Analysis of GBP/USD 4H
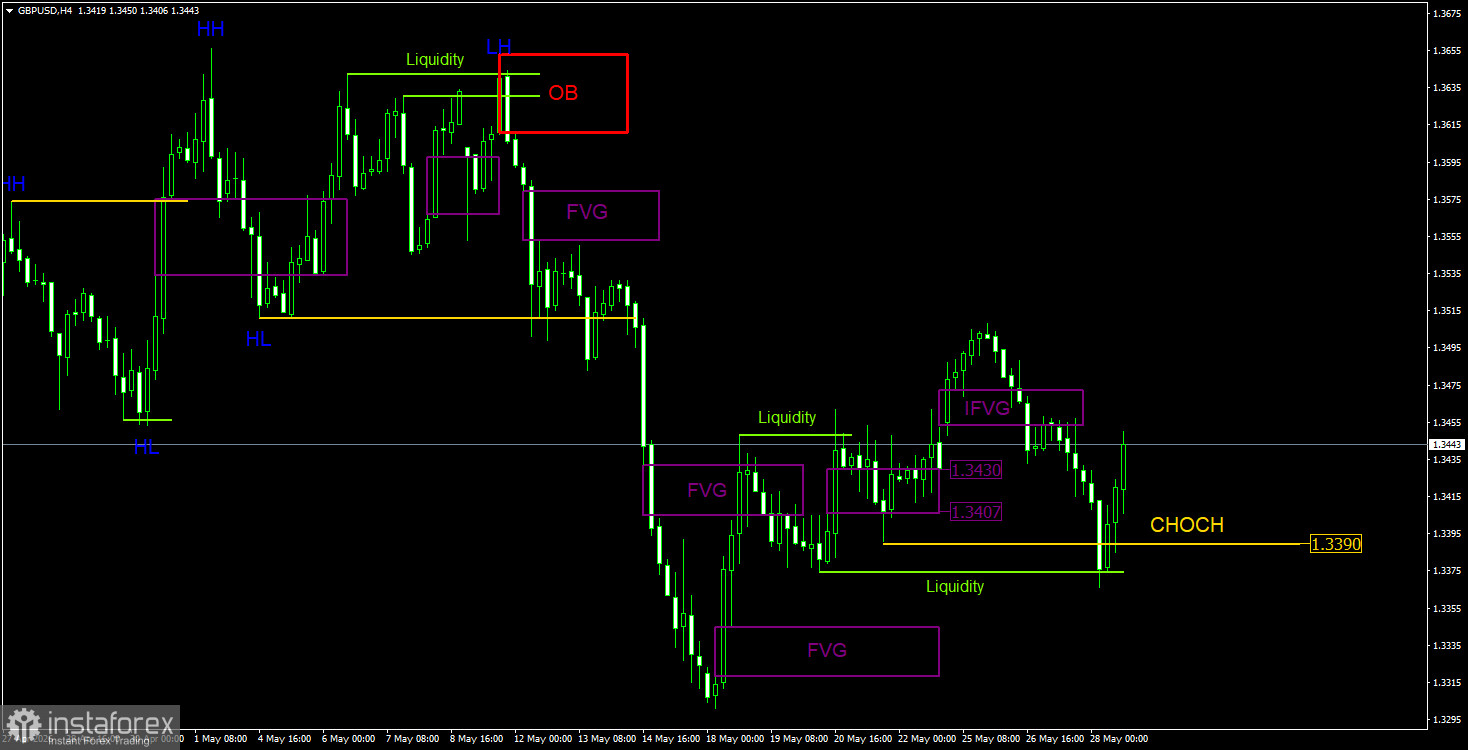
On the 4-hour timeframe, the British pound did not receive a re-response to the "bullish" FVG in the area of 1.3453-1.3472; it consolidated below it, turning it into a "bearish" IFVG, and responded to the newly formed pattern. Therefore, the decline continued on Thursday morning. The drop ended after liquidity on the buy side was removed from the last two local low. No new patterns have been formed yet.
Analysis of GBP/USD 1H
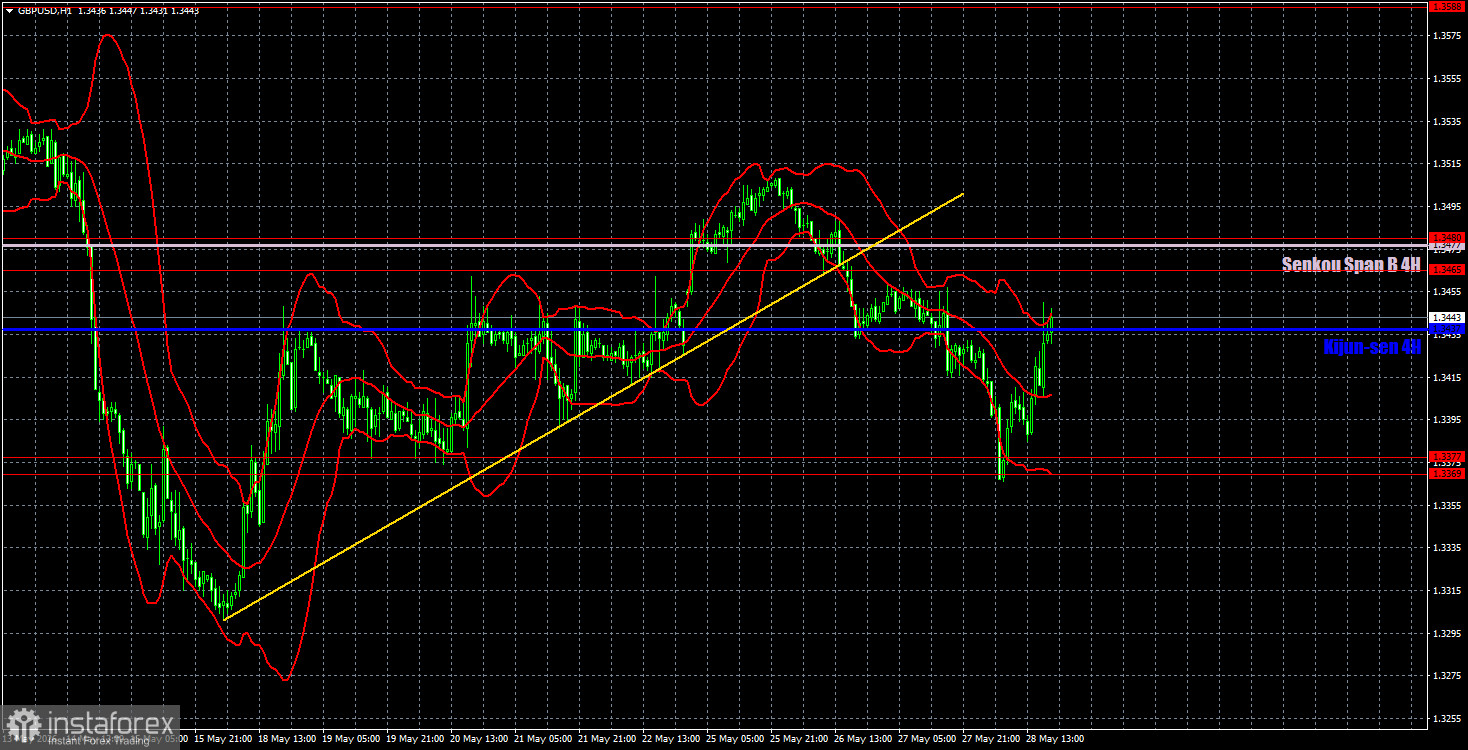
On the hourly timeframe, the GBP/USD pair has completed its upward trend due to renewed escalation around the Strait of Hormuz. The macroeconomic and fundamental background continues to have little influence on the pair's movements, and this week it is virtually absent. We do not believe that without a real escalation of the conflict in the Middle East, the dollar can show strong growth. The American currency can only hope for a failure of the negotiations between Iran and the U.S.
For May 29, we highlight the following important levels: 1.3096-1.3115, 1.3179-1.3187, 1.3369-1.3377, 1.3465-1.3480, 1.3588, 1.3671-1.3681, 1.3751-1.3763. The Senkou Span B line (1.3477) and the Kijun-sen line (1.3437) may also serve as sources of signals. It is recommended to set the Stop Loss level to breakeven if the price moves in the correct direction by 20 pips. The lines of the Ichimoku indicator may shift during the day, which should be considered when determining trading signals.
On Friday, there are no economic releases planned in the UK or the U.S. The only notable event is Andrew Bailey's morning speech. If the Bank of England governor mentions anything important regarding monetary policy, inflation, and the upcoming meeting, it could provoke a market reaction.
Trading Recommendations:
Today, traders may open short positions targeting 1.3369-1.3377 if the pair bounces from the 1.3465-1.3480 area. Long positions will become relevant after breaching the 1.3465-1.3480 area, targeting 1.3588. There are currently no new patterns on the 4-hour timeframe, so their formation should be anticipated.
Explanations for Illustrations:
- Support and resistance price levels are indicated by thick red lines where price movement may end. They are not sources of trading signals.
- The Kijun-sen and Senkou Span B lines are Ichimoku indicator lines that are transferred from the 4-hour timeframe to the hourly timeframe. They are strong lines.
- Extremum levels are thin red lines from which the price has previously bounced. They are sources of trading signals.
- Yellow lines represent trend lines, trend channels, and any other technical patterns.
- CHOCH stands for Change of Character in trend structure.
- Liquidity refers to Stop Loss, pending orders that market makers use to build their positions.
- FVG is a Fair Value Gap. Price moves through such areas very quickly, indicating a complete absence of one side in the market. Subsequently, the price tends to return and react from such areas in continuation of the main trend.
- IFVG is an Inverted Fair Value Gap. After returning to such an area, the price does not react and impulsively breaks through, then tests from the other side.
- OB stands for Order Block. A candle on which the market maker opened a position to take liquidity to form their own position in the opposite direction.