 English
 Русский
 Bahasa Indonesia
 Bahasa Malay
 ไทย
ไทย Español
 Deutsch
 Български
 Français
 Tiếng Việt
 中文
中文 বাংলা
বাংলা हिन्दी
 Čeština
 Українська
 Română


The GBP/USD currency pair declined moderately throughout Thursday, with volatility even decreasing for the historically active British pound. Yes, the pound is trading in a way that suggests traders can expect profits. However, its activity is also declining. What does this indicate? It suggests something similar to the decline in Bitcoin trading volumes, which have been falling for the past eight months. The market is reluctant to open trades in conditions of complete uncertainty and obvious chaos in geopolitical affairs.
If we try to count how many times the geopolitical backdrop has changed over the last two months, our fingers would fall short. And with each such reversal, the market must adjust, as it may entail long-term consequences. Thus, the market has been swinging up and down for two months. In the case of the British pound, the overall picture has become somewhat simpler in recent weeks. There are clearly more factors contributing to the pound's decline than before.
We should start with the political crisis that erupted in Great Britain this month. Keir Starmer's party suffered a resounding defeat in local elections, while the Conservative Party (which has been ruling the country for 14 years) also failed to win. This indicates that the level of trust in the two main parties is declining year by year among the British. Now the choice is no longer just between the Conservatives and Labour; it is much wider, and the country's political landscape will be much more fragmented and disjointed, making it challenging to establish a clear, unified political and economic course.
Scotland is once again talking about a referendum, as the last ten years have shown that a lasting alliance with Britain is hard to achieve. Scotland desperately wants to return to the European Union. Its opinions were not sought during the Brexit referendum ten years ago, and choosing between Britain and the EU, Edinburgh wants to opt for the European alliance.
The Bank of England has every reason to abandon its tightening of monetary policy in 2026, although just a few weeks ago, the baseline scenario included 2-3 interest rate hikes by the end of the year. Inflation in the UK is decreasing, so there is no need for policy tightening.
The cherry on top is geopolitics. We do not know how the negotiations between Iran and the U.S. are genuinely progressing or at what stage they are. One thing is for sure — a deal is still nowhere in sight. If asked to estimate the likelihood of an agreement based on the current information, we would say it stands at 5%. And this 5% is a hope for a miracle. We are now orienting only by the statements made by Iranian officials, as according to Donald Trump, the U.S. has already won, Iran is destroyed, there is no nuclear threat (but please hand over the nuclear fuel), and a deal may be signed "soon." However, if not, Iran will be destroyed again. Along with it, Oman and anyone on Iran's side will face similar fates. Thus, geopolitics continues to weigh on the GBP/USD pair.
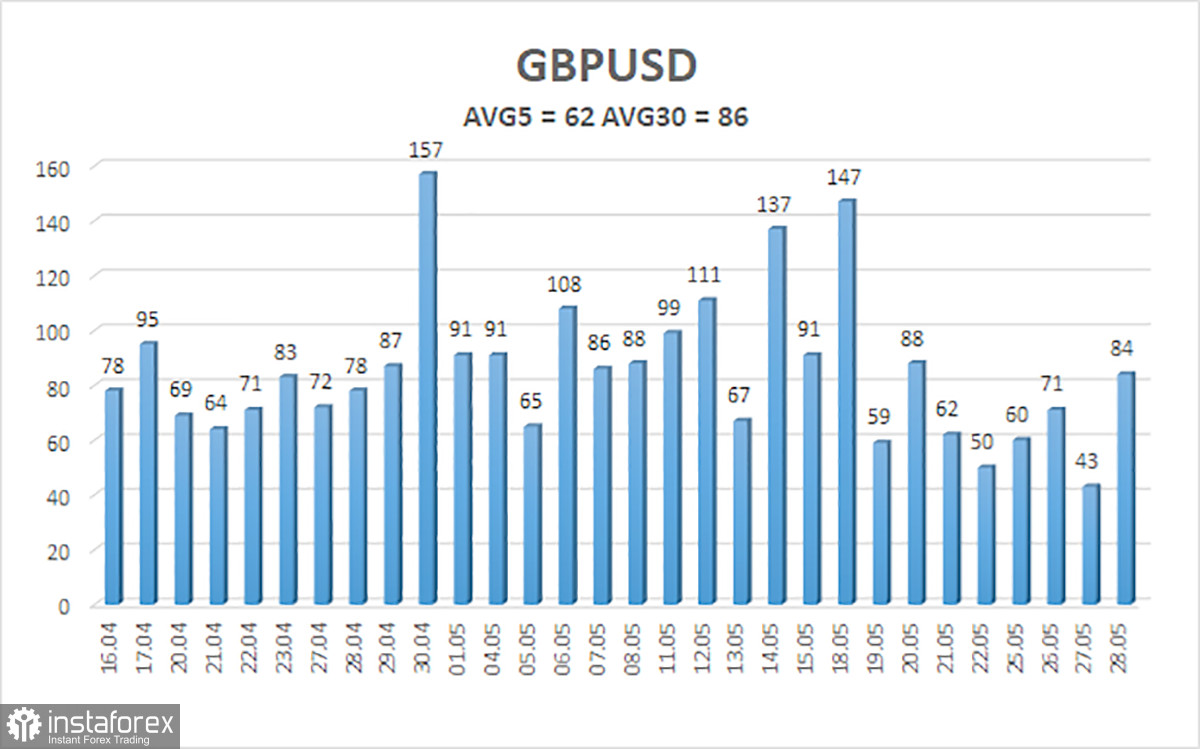
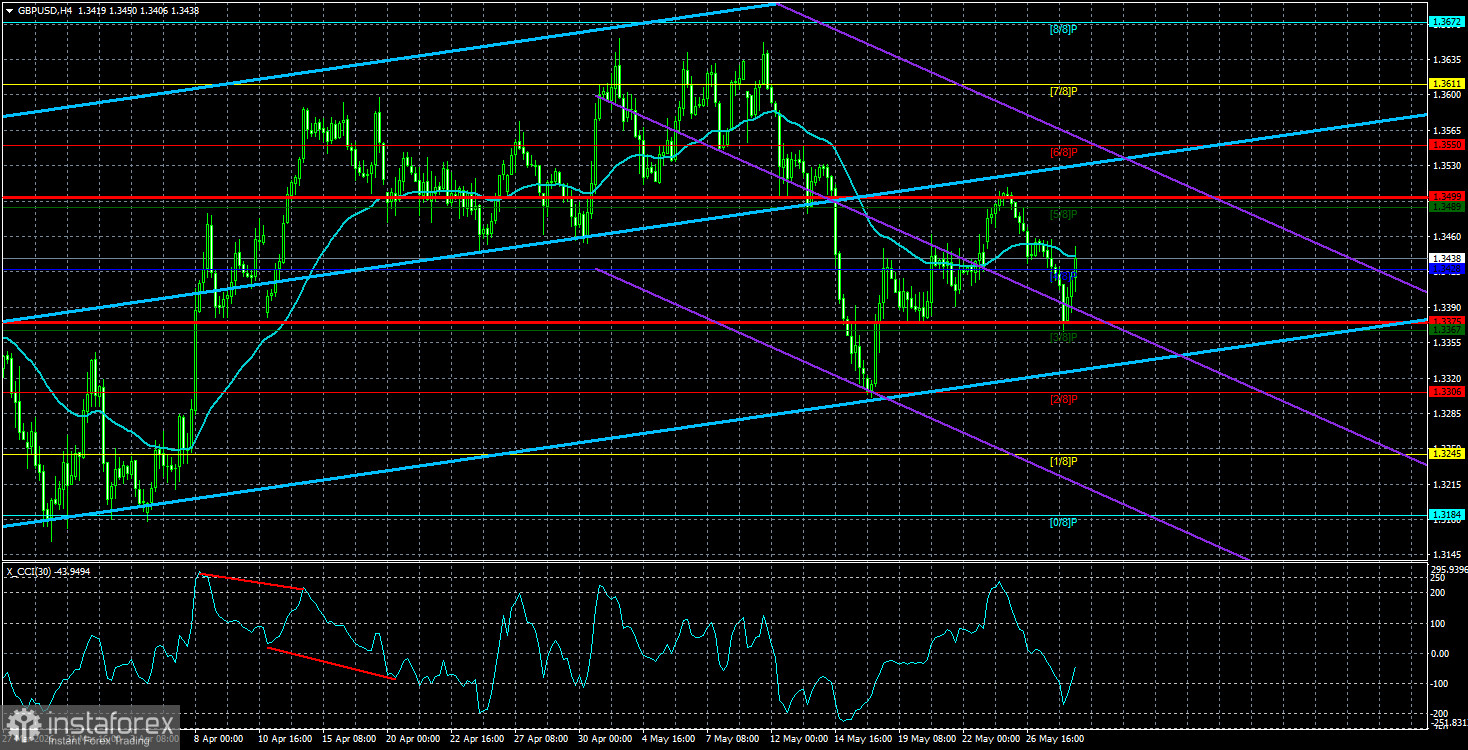
The average volatility of the GBP/USD pair over the last 5 trading days, as of May 29, is 62 pips, categorized as "medium-low." On Friday, May 29, we expect the pair to trade within the range between 1.3375 and 1.3499. The upper channel of the linear regression has turned upward, indicating a resumption of a bullish trend. The CCI indicator has not formed signals recently.
Nearest Support Levels:
- S1 – 1.3428
- S2 – 1.3367
- S3 – 1.3303
Nearest Resistance Levels:
- R1 – 1.3489
- R2 – 1.3550
- R3 – 1.3611
Trading Recommendations:
The GBP/USD currency pair continues to recover after a 300-point drop. Trump's policies will continue to exert pressure on the U.S. economy, so we do not expect the American currency to show long-term growth. However, 2026 still looks very positive for the dollar. Thus, long positions with targets of 1.3550 and 1.3611 can be considered when the price is above the moving average. If the price is below the moving average line, short trades can be contemplated with targets of 1.3367 and 1.3306 on geopolitical grounds. Market conditions frequently change; the market continues to focus primarily on geopolitical news, which lacks uniform character.
Explanations for Illustrations:
- Regression channels help determine the current trend. If both are oriented in the same direction, the trend is currently strong.
- The moving average line (settings 20,0, smoothed) defines the short-term trend and the direction in which trading should currently be conducted.
- Murray levels are target levels for movements and corrections.
- Volatility levels (red lines) indicate the likely price channel in which the pair will operate over the next day based on current volatility readings.
- The CCI indicator — its entry into the oversold area (below -250) or into the overbought area (above +250) indicates that a trend reversal in the opposite direction is approaching.