 English
  Русский
 Bahasa Indonesia
 Bahasa Malay
 ไทย
ไทย Español
 Deutsch
 Български
 Français
 Tiếng Việt
 中文
中文 বাংলা
বাংলা हिन्दी
 Čeština
 Українська
 Română

Trade Analysis of Thursday:
1H Chart of the GBP/USD Pair
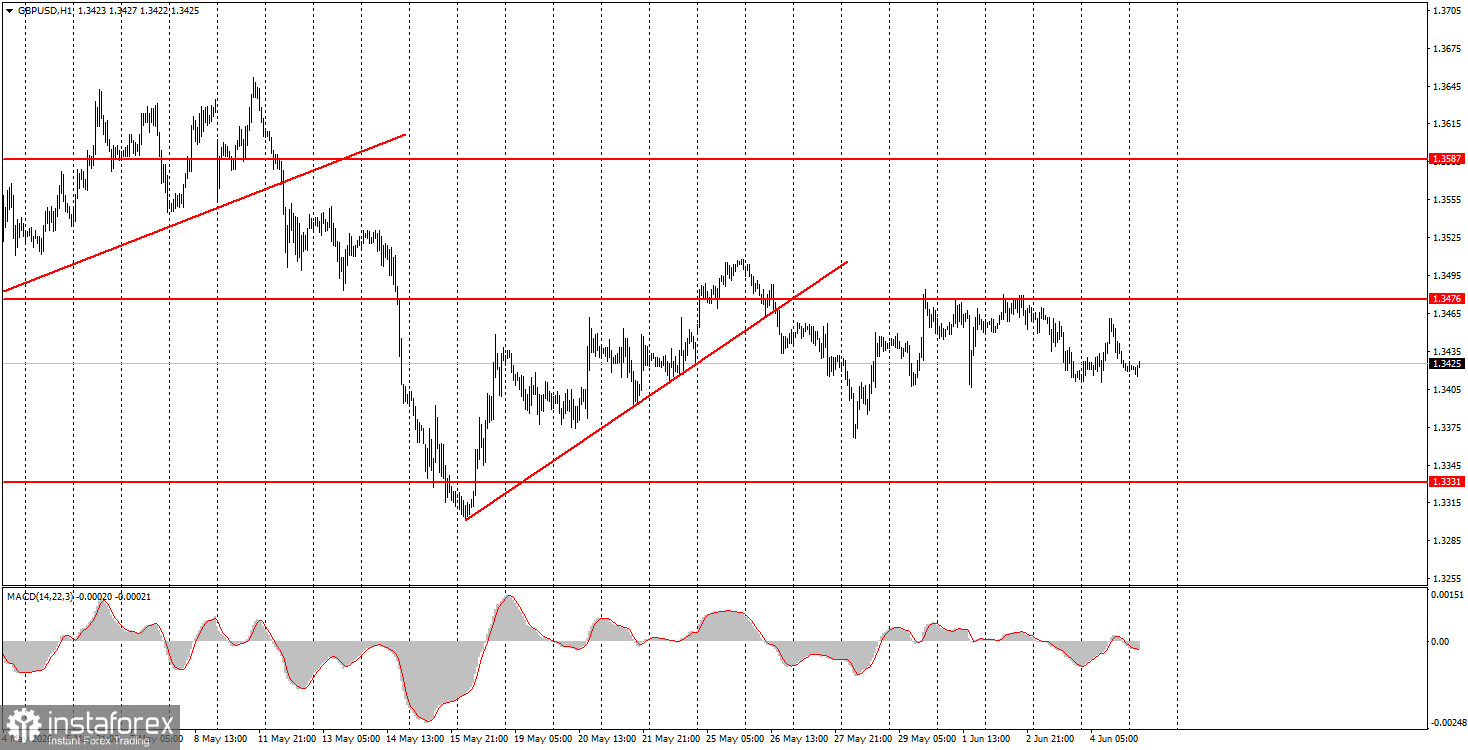
The GBP/USD pair demonstrated absolutely sideways movement with low volatility on Thursday. In recent weeks, the British currency has also been trading in a sideways channel, and the market did not react to quite important and positive reports from the US this week. Therefore, we highly doubt that the most significant reports, such as Non-Farm Payrolls and the unemployment rate, to be released today will be able to stir the market. For traders, geopolitics remains the priority, but currently, only 5-10% of the total news and events are being factored in. The market no longer takes Donald Trump at his word and does not consider another rocket attack in the Persian Gulf region as an escalation of the conflict. The world has gotten used to the fact that negotiations continue but yield no results. Iran and the US regularly attack each other and violate ceasefire agreements, but war does not resume. Trump promises a deal in the next couple of days, while Iran refutes such statements a few hours later.
5M Chart of the GBP/USD Pair
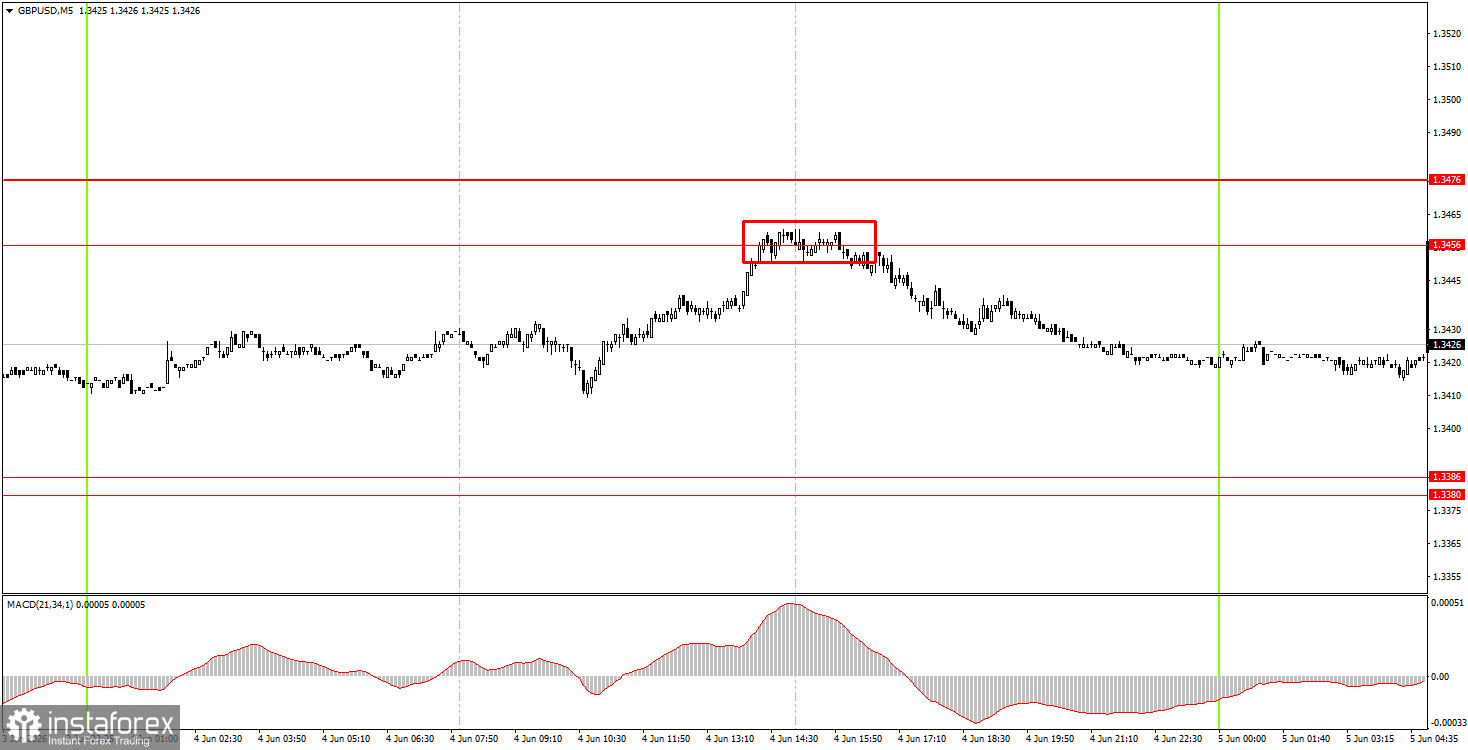
On the 5-minute timeframe on Thursday, one sell trading signal was formed. At the start of the American trading session, the price bounced from the 1.3456-1.3476 area and then dropped by 20 pips by the end of the day. Additionally, the short position could be carried over to Friday, given the current weakness in market movements. In one day, the price simply cannot cover a significant distance.
How to Trade on Friday:
On the hourly timeframe, the GBP/USD pair continues to form a downward trend, as geopolitics is once again deteriorating, and the trendline has been broken. However, without a resumption of full-scale war in the Middle East, the dollar cannot expect to grow as it did in February-March. Individual events may still prompt further strengthening, but we do not believe the market will trigger a new wave of risk aversion.
On Friday, novice traders can remain in short positions with a target of 1.3380-1.3386 after bouncing from the area of 1.3456-1.3476. A bounce in the 1.3380-1.3386 area will allow opening long positions with targets of 1.3456-1.3476. It should be remembered that volatility is low.
On the 5-minute timeframe, trading levels to consider are 1.3175-1.3180, 1.3259-1.3267, 1.3319-1.3331, 1.3380-1.3386, 1.3456-1.3476, 1.3587-1.3598, 1.3631-1.3641, 1.3695, and 1.3741-1.3751. In the UK, the events calendar for Friday remains empty, while in the US, important reports on the labor market and unemployment will be released. However, it is unlikely that they will lead to the end of the flat.
Basic Rules of the Trading System:
- The strength of a signal is determined by the time required to form it (a bounce or a breakout). The less time taken, the stronger the signal.
- If two or more trades were opened at a particular level based on false signals, subsequent signals from that level should be ignored.
- In a flat market, any pair may form many false signals or none at all. Technical levels may be disregarded.
- On the hourly timeframe, trading signals from the MACD indicator should be executed only when volatility is good, and a trend is confirmed by a trend line or channel.
- If two levels are too close together (5 to 20 pips), they should be considered a support or resistance area.
- After moving 15 pips in the correct direction, a Stop Loss should be set at breakeven.
What's on the Charts:
Price levels (areas) of support and resistance are targets when opening long or short positions or sources of signals.
Red lines indicate channels or trend lines that display the current trend and indicate the preferred direction for trading.
The MACD indicator (14,22,3) – histogram and signal line – is a supplementary indicator that can also be used as a source of signals.
Important speeches and reports (contained in the news calendar) can significantly impact the movement of the currency pair. Therefore, during their release, trading should be conducted with maximum caution, or one should exit the market to avoid sharp reversals against preceding movements.
Beginners trading in the forex market should remember that not every trade can be profitable. Developing a clear strategy and practicing money management are keys to success in trading over the long term.