 English
  Русский
 Bahasa Indonesia
 Bahasa Malay
 ไทย
ไทย Español
 Deutsch
 Български
 Français
 Tiếng Việt
 中文
中文 বাংলা
বাংলা हिन्दी
 Čeština
 Українська
 Română

Bitcoin and Ethereum saw slight increases yesterday following the US inflation data. However, Bitcoin is still trading below $63,000, while Ethereum cannot seem to establish itself above $1,650.

Meanwhile, outflows from spot Bitcoin ETFs continue for the seventeenth consecutive day — a drop of $77.4 million yesterday and a decrease of $40.9 million from Ethereum ETFs. Among altcoins, only XRP (+$7.4 million) and SOL (+$749,000) showed any slight movement; everything else is at zero. Total outflows since mid-May have already exceeded $5.4 billion, and yesterday continued this trend. However, there appears to be an interesting contradiction in the data: despite ongoing institutional pressure, Bitcoin has not dropped for a week. Seventeen red days in ETFs, and yet the price remains stable. This atypical behavior deserves attention.
A more telling comparison can be made with the stock market. Bitcoin has held up significantly better than the S&P 500 over the past week, even as the S&P 500 faces its own pressures amid inflationary turbulence — the CPI data for May showed a year-over-year rate of 4.2%, the highest since April 2023. Rising inflation is typically a negative factor for risk assets; however, Bitcoin does not follow its usual correlation with the Nasdaq this time. Possible explanations include major long-term buyers quietly absorbing selling pressure, preventing the price from declining.
The resolution may come from several fronts simultaneously. The Federal Reserve meeting on June 16-17 under new Chairman Kevin Warsh will signal to the market the future of monetary policy — and if the central bank takes a tough stance, pressure on risk assets will intensify.
Bitcoin
Buying Scenario
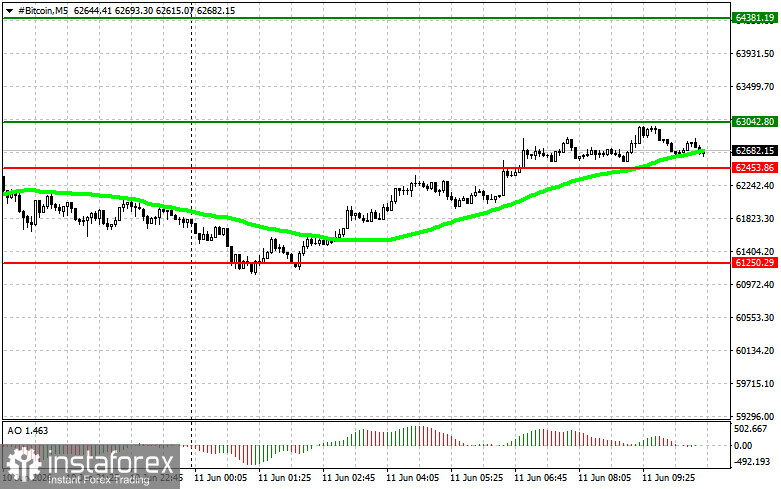
Scenario #1: I plan to buy Bitcoin today upon reaching an entry point around $63,000 with a target growth to the level of $64,300. Near $64,300, I will exit my buy positions and sell immediately for a pullback. Before buying on a breakout, ensure that the 50-day moving average is below the current price and that the Awesome indicator is above zero.
Scenario #2: Bitcoin can also be purchased from the lower boundary of $62,400 if there is no market reaction to a breakout above it, targeting levels $63,300 and $64,300.
Selling Scenario
Scenario #1: I plan to sell Bitcoin today after reaching an entry point around $62,400, targeting a drop to $61,300. Near $61,300, I will exit my sell positions and buy immediately for a pullback. Before selling on a breakout, ensure that the 50-day moving average is above the current price and that the Awesome indicator is below zero.
Scenario #2: Bitcoin can also be sold from the upper boundary of $63,000 if there is no market reaction to a breakout above, targeting levels $62,400 and $61,200.
Ethereum
Buying Scenario
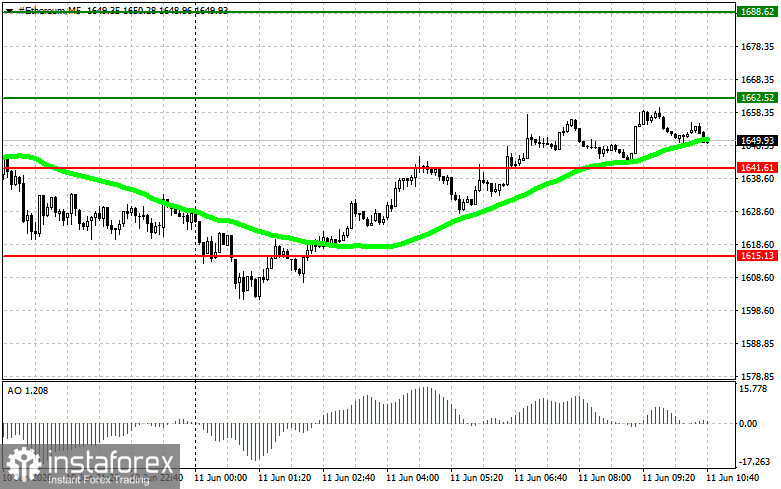
Scenario #1: I will buy Ethereum today at an entry point around $1,662, targeting $1,688. Near $1,688, I will exit my buy positions and sell immediately for a pullback. Before buying on a breakout, ensure that the 50-day moving average is below the current price and that the Awesome indicator is above zero.
Scenario #2: Ethereum can also be bought from the lower boundary of $1,641 if there is no market reaction to a breakout above it, targeting levels $1,662 and $1,688.
Selling Scenario
Scenario #1: I plan to sell Ethereum today at an entry point around $1,641, targeting a drop to $1,615. Near $1,615, I will exit my sell positions and buy immediately for a pullback. Before selling on a breakout, ensure that the 50-day moving average is above the current price and that the Awesome indicator is below zero.
Scenario #2: Ethereum can also be sold from the upper boundary of $1,662 if there is no market reaction to a breakout above, targeting levels $1,641 and $1,615.