 English
  Русский
 Bahasa Indonesia
 Bahasa Malay
 ไทย
ไทย Español
 Deutsch
 Български
 Français
 Tiếng Việt
 中文
中文 বাংলা
বাংলা हिन्दी
 Čeština
 Українська
 Română

Analysis of GBP/USD 5M
The GBP/USD currency pair also started sharply higher on Monday, but then eased and lost more than it gained by the end of the day. The reasons for the movements in the GBP/USD pair were the same as those for the EUR/USD. The fundamental and geopolitical backdrop was identical for both pairs. Thus, the market currently maintains only very cautious optimism regarding the ceasefire between Iran and the US and the opening of the Strait of Hormuz. Moreover, the agreement has not yet been signed, and the strait remains closed. This week, the British pound faces three key tests. First, there is geopolitics. If the agreement is not signed by Friday, the market may return to buying dollars, as it may again lose faith in the ceasefire in the Middle East. Second, there is the Bank of England meeting. Third, the Federal Reserve meeting. While the central banks are not planning to tighten monetary policy, the market's reaction to these events may still follow.
From a technical standpoint, the downward trend has been canceled as the price has crossed the Ichimoku indicator lines. However, whether the upward movement will continue is still a big question. Everything will depend on geopolitics. If it turns out that the ceasefire has broken down again, the dollar will rise, and the British pound will fall. Iran and Pakistan have confirmed the achievement of an agreement, but on Monday, Trump threatened Iran with strikes again if it does not agree to the nuclear deal in the future.
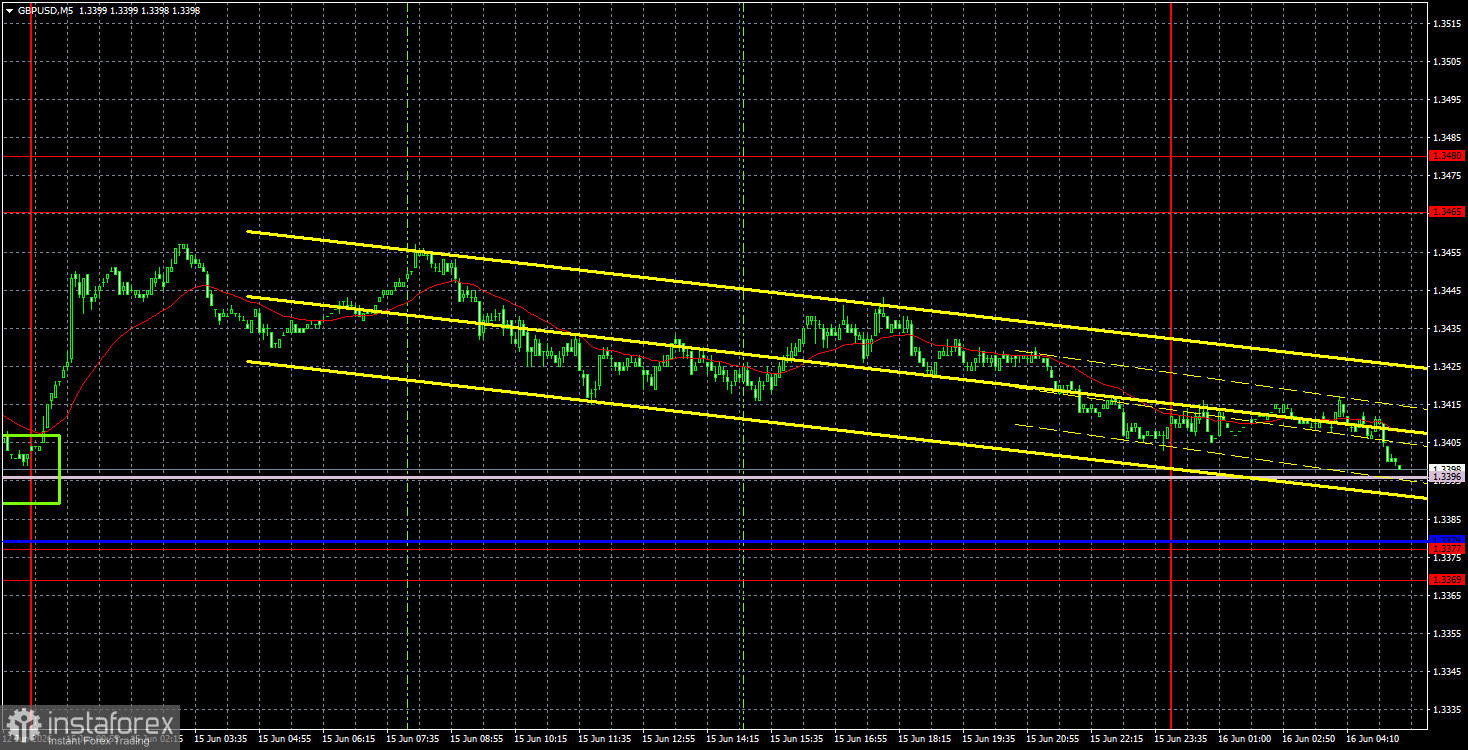
On the 5-minute timeframe, a buy signal was formed on Monday, after which the pair moved up by about 40 pips. The price bounced off the Senkou Span B line, but traders likely did not have time to act on this signal. No other signals were formed during the day. The target area of 1.3465-1.3480 was also not reached. Volatility was low.
COT Report
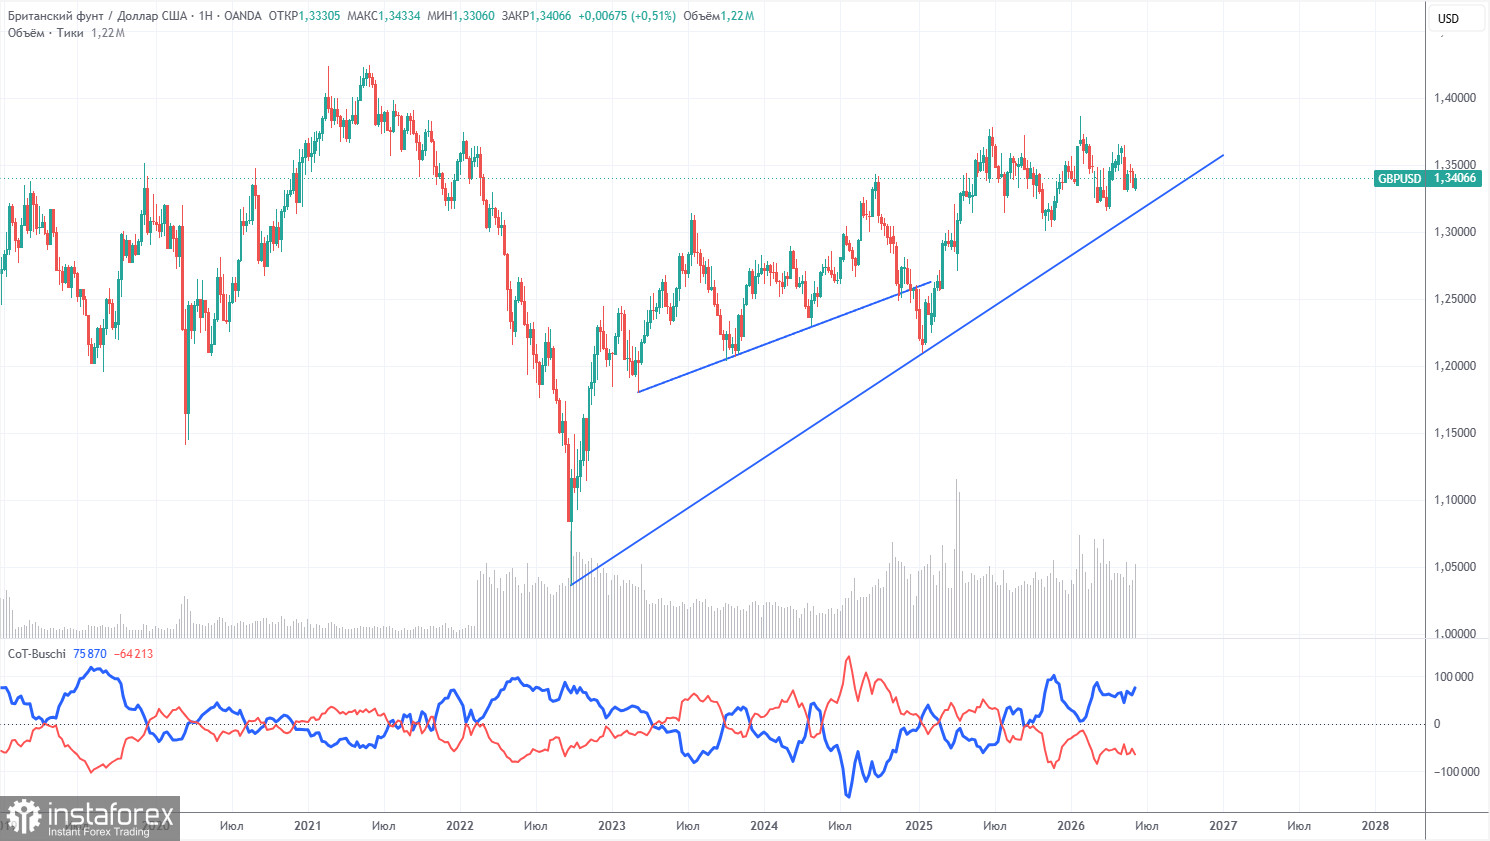
COT reports on the British pound indicate that, in recent years, commercial traders' sentiment has been constantly changing. The red and blue lines, showing the net positions of commercial and non-commercial traders, frequently intersect and are mostly near the zero mark. Currently, the lines are moving apart from each other, and non-commercial traders still dominate with... short positions. Given the events in the Middle East, it is no surprise that demand for risk currencies is low.
In the long term, the dollar continues to weaken due to Donald Trump's policies, which is clearly visible on the weekly timeframe (illustration above). The trade war will continue in one form or another for a long time, with Trump's policies aimed both directly and indirectly at weakening the US currency. However, geopolitical factors currently hold the top position, having recently strengthened the dollar. Since the conflict in the Middle East is not yet resolved, the US dollar may still show growth potential. According to the latest COT report (from June 9), the "Non-commercial" group closed 7,900 Buy contracts and opened 4,000 Sell contracts, resulting in a net position drop of 11,900 contracts over the week.
Analysis of GBP/USD 1H
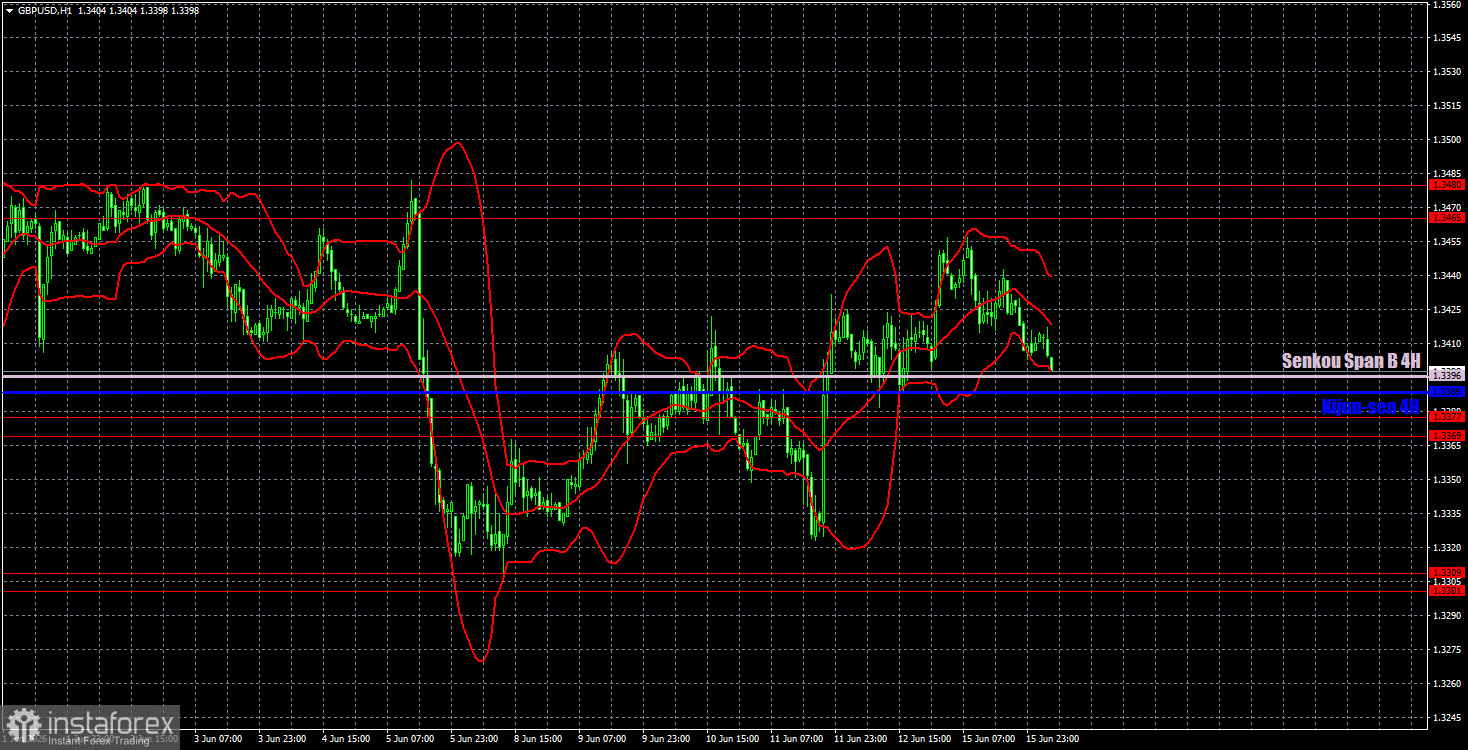
On the hourly timeframe, the GBP/USD pair has begun to form a new upward trend amid warming relations between Iran and the US. The macroeconomic and fundamental backdrop continues to have little impact on the pair's movements (with rare exceptions). Without a real escalation in the Middle East conflict, the dollar is unlikely to show a strong trend, while de-escalation and a peace deal would support further growth of the pair.
For June 16, we highlight the following important levels: 1.3096-1.3115, 1.3179-1.3187, 1.3301-1.3309, 1.3369-1.3377, 1.3465-1.3480, 1.3588, 1.3671-1.3681, and 1.3751-1.3763. The Senkou Span B line (1.3396) and the Kijun-sen line (1.3389) may also serve as signal sources. It is recommended to set the Stop Loss level to break even if the price moves in the right direction by 20 pips. The Ichimoku indicator lines may shift throughout the day, which should be taken into account when determining trading signals.
On Tuesday, there are no important events or reports scheduled in the UK, while reports on the construction sector will be released in the US, which can be considered secondary. Thus, the market's attention will likely once again be fully focused on geopolitical events.
Trading Recommendations:
Today, traders may consider short positions targeting 1.3301-1.3309 if the pair settles below the 1.3369-1.3377 area. Long positions may become relevant in the event of a bounce off the Senkou Span B line with a target of 1.3465-1.3480.
Explanations for the Illustrations:
Support and resistance price levels (resistance/support) – thick red lines around which movement may end. They are not sources of trading signals.
Kijun-sen and Senkou Span B lines – Ichimoku indicator lines transferred from the 4-hour timeframe to the hourly timeframe. They are strong lines.
Extreme levels – thin red lines from which the price previously rebounded. They are sources of trading signals.
Yellow lines – trend lines, trend channels, and any other technical patterns.
Indicator 1 on COT charts – the size of the net position of each category of traders.