 English
  Русский
 Bahasa Indonesia
 Bahasa Malay
 ไทย
ไทย Español
 Deutsch
 Български
 Français
 Tiếng Việt
 中文
中文 বাংলা
বাংলা हिन्दी
 Čeština
 Українська
 Română

Bitcoin and Ethereum have turned down again, and there are many reasons for the new decline. In our view, it's very simple. A downtrend began last year, and it has not ended yet — there are no signs it has finished. Therefore, Bitcoin and Ethereum can continue their fall for purely technical reasons. In addition, with high US inflation, the Federal Reserve could raise the key interest rate once or twice in 2026, which is not good for risk assets. Institutional investors continue reallocating capital from unprofitable Bitcoin (and even more so from other cryptocurrencies) into tech stocks and the AI sector, which look more promising in 2026. Miners are also shifting their production capacity from crypto mining to providing services to the AI sector. In short, everything is stacking up against the crypto market.
Meanwhile, BTC.TOP mining-pool CEO Jiang Zhuoer said Bitcoin could fall into the $42,000–44,000 area by the end of this year within the current cycle. However, you don't need to be a mining?pool CEO to make such a forecast. After every bull trend, Bitcoin retreats in a correction that lasts roughly a year. Relying only on historical data to claim Bitcoin will definitely finish its decline in Q4 2026 is wrong. Remarkably, 2025 was the first year in history when Bitcoin did not rise in price after a halving. That fact undermines the paradigm of many traders who believe the halving must trigger at least a twofold increase in Bitcoin; otherwise, mining would be uneconomical.
As we can see, miners easily found an outlet in 2026: they simply moved into the AI sector, which desperately needs computing power. Mr. Jiang also pointed to Strategy's mNAV indicator, which has now fallen to 0.72 and reached 0.7 in the previous downtrend. Thus, Jiang believes the market "bottom" could form within the next six months.
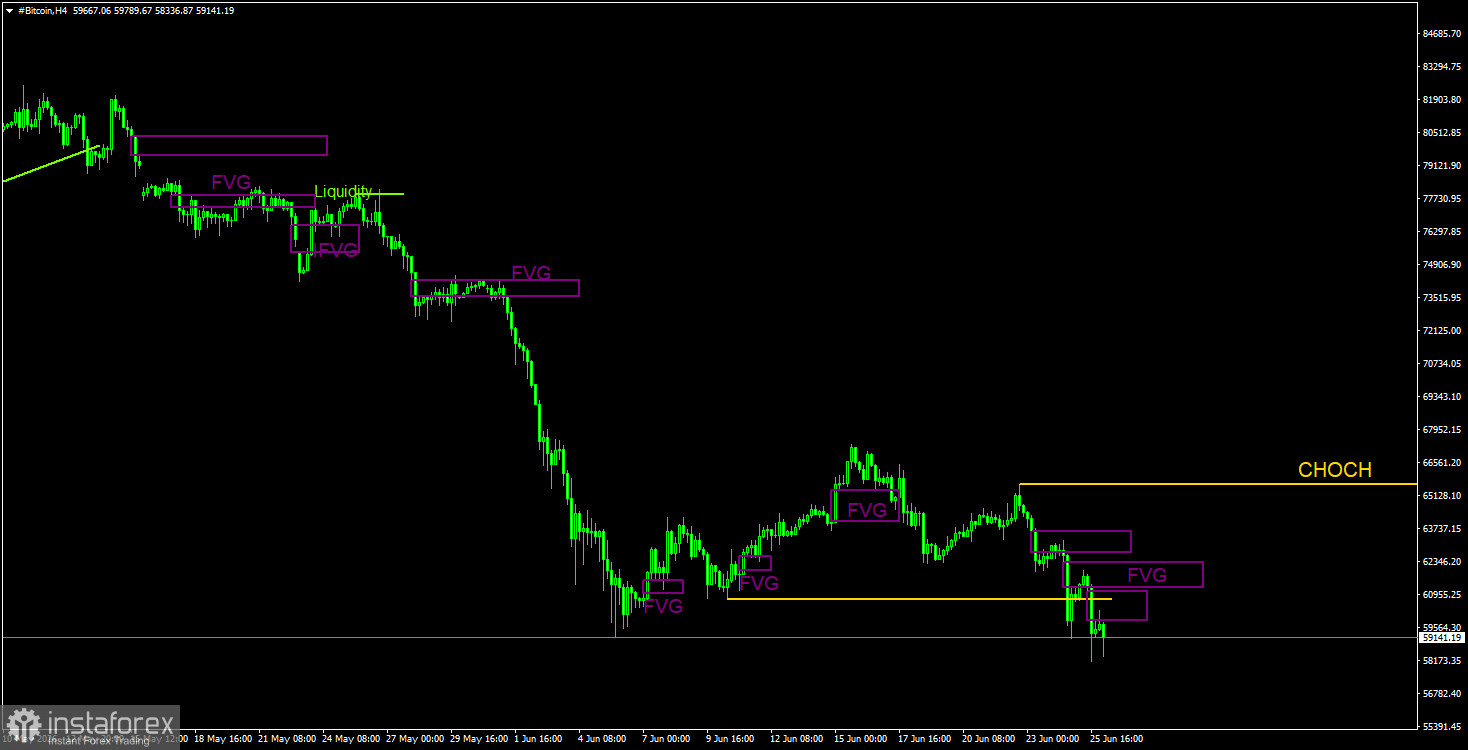
Trading recommendations on BTC/USD
Bitcoin is still following a full-fledged downtrend. We still expect a decline toward $57,500 (the 61.8% Fibonacci level of the three-year uptrend), and there are no signs of a trend reversal yet. The latest bearish FVG was formed in the $68,000–$70,700 area, so that region serves as a POI for short positions in the coming weeks. On the 4-hour timeframe, three sell signals have already formed in bearish FVGs, and the bullish structure has been broken.
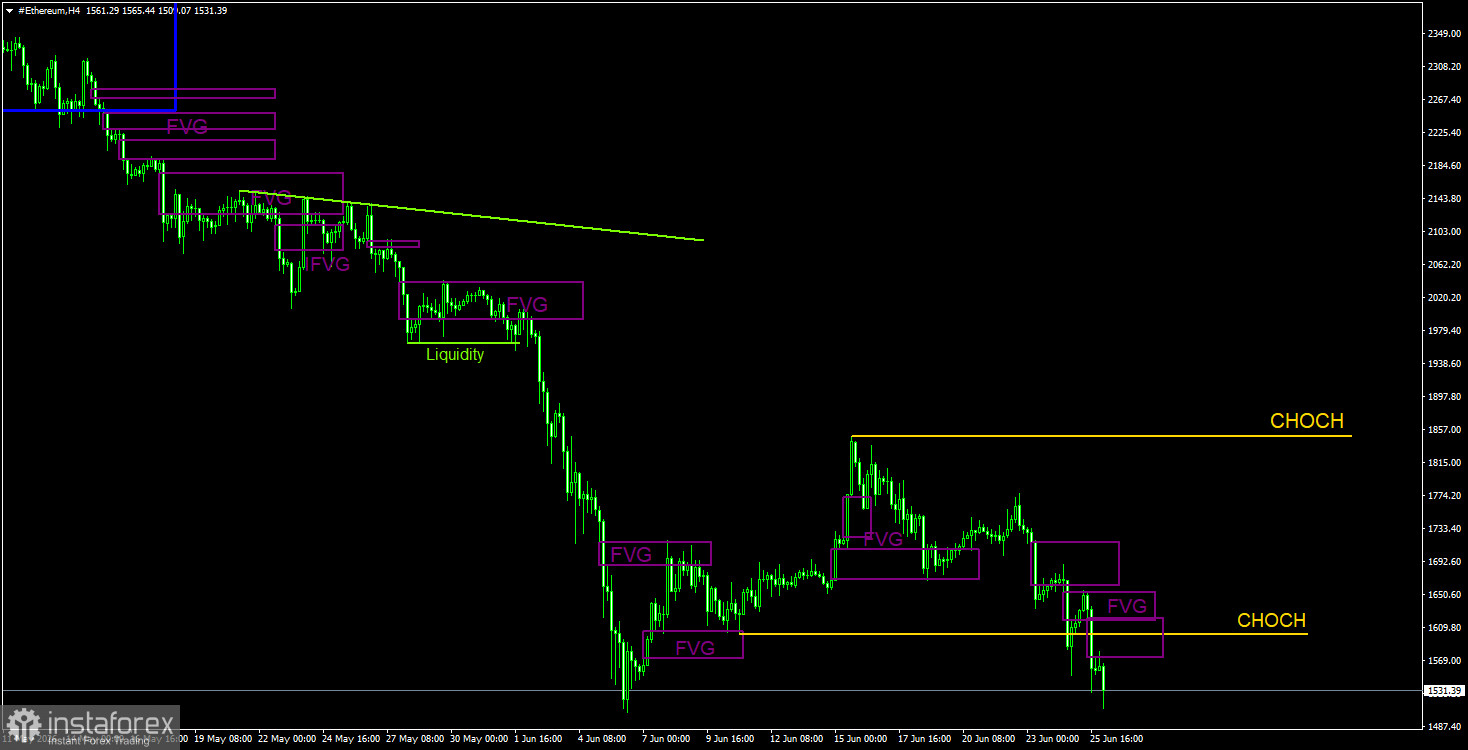
Trading recommendations on ETH/USD
On the daily timeframe, the downtrend that began in August last year is still in progress. The key sell pattern remains the bearish order block on the weekly timeframe. We do not believe the current downtrend is over — there are no signs of its completion for either Bitcoin or Ethereum. Ethereum has resumed its decline with targets at $1,391 and $788. On the 4?hour timeframe, the bullish structure has been broken, confirming the resumption of the downtrend. The last three bearish FVGs worked out and produced sell signals that could have been traded.
Comments on the charts
CHOCH — change of character / break of the trend structure. Liquidity — traders' Stop?Losses that market?makers use to build their positions. FVG — Fair Value Gap (area of price inefficiency). The price often moves quickly through such areas, indicating the absence of one side in the market. Later, the price tends to return and react to these zones. IFVG — Inverted Fair Value Gap. After a return to such a zone, the price does not react but impulsively breaks through and then tests it from the other side.
OB — Order Block. A candle on which a market?maker opened a position in order to harvest liquidity and then form their own position in the opposite direction.