 English
 Русский
 Bahasa Indonesia
 Bahasa Malay
 ไทย
ไทย Español
 Deutsch
 Български
 Français
 Tiếng Việt
 中文
中文 বাংলা
বাংলা हिन्दी
 Čeština
 Українська
 Română


Bitcoin and Ethereum continue to trade not far from their one?year lows. Over the past week, the two major crypto assets have managed a small correction, but there is still no sign of an end to the downtrend that began last year. There has only been liquidity removal on the 4?hour timeframe for Bitcoin, which allowed a modest correction — the one we're seeing now. The fundamental backdrop remains weak for the crypto segment, mainly reflected in low spot demand, a capital shift into the AI sector, and the Fed's commitment to reaching 2% inflation, which implies at least the maintenance of tight monetary policy. Thus, we still see no grounds for a sustained rise in Bitcoin and Ethereum.
Meanwhile, Michael Saylor's company, which until recently adhered to the "never sell Bitcoin" principle, has started selling Bitcoin. That says all you need to know about the attractiveness of "digital gold" to investors right now. If the largest public holder of Bitcoin has started selling, it sends a signal to the market. Whatever Michael Saylor says in interviews, Strategy is experiencing liquidity problems. If it weren't, it wouldn't be selling Bitcoin. I remind you that purchases of "digital gold" have been financed by issuing common and preferred shares — i.e., borrowed capital on which interest must be paid. Strategy's average purchase price for Bitcoin is above the current price. Thus, all investments in "digital gold" are currently underwater. And dividends on the shares must be paid every month.
Experts estimate that Strategy's current dollar reserves will only last 14 months, whereas not long ago, they were sufficient to cover dividends for seven years. After selling 3,588 coins, the company's dollar reserve rose to $2.55 billion, and the dividend rate on preferred shares is now 12%. STRC shares are a key source of capital for replenishing Bitcoin holdings. They are currently trading below par value, as are the common shares. To attract new buyers, the company is raising dividend payments, but in our view, demand for Strategy shares will remain low in the near term. If Bitcoin does not start a bullish trend in 2026, liquidity problems are likely to recur regularly.
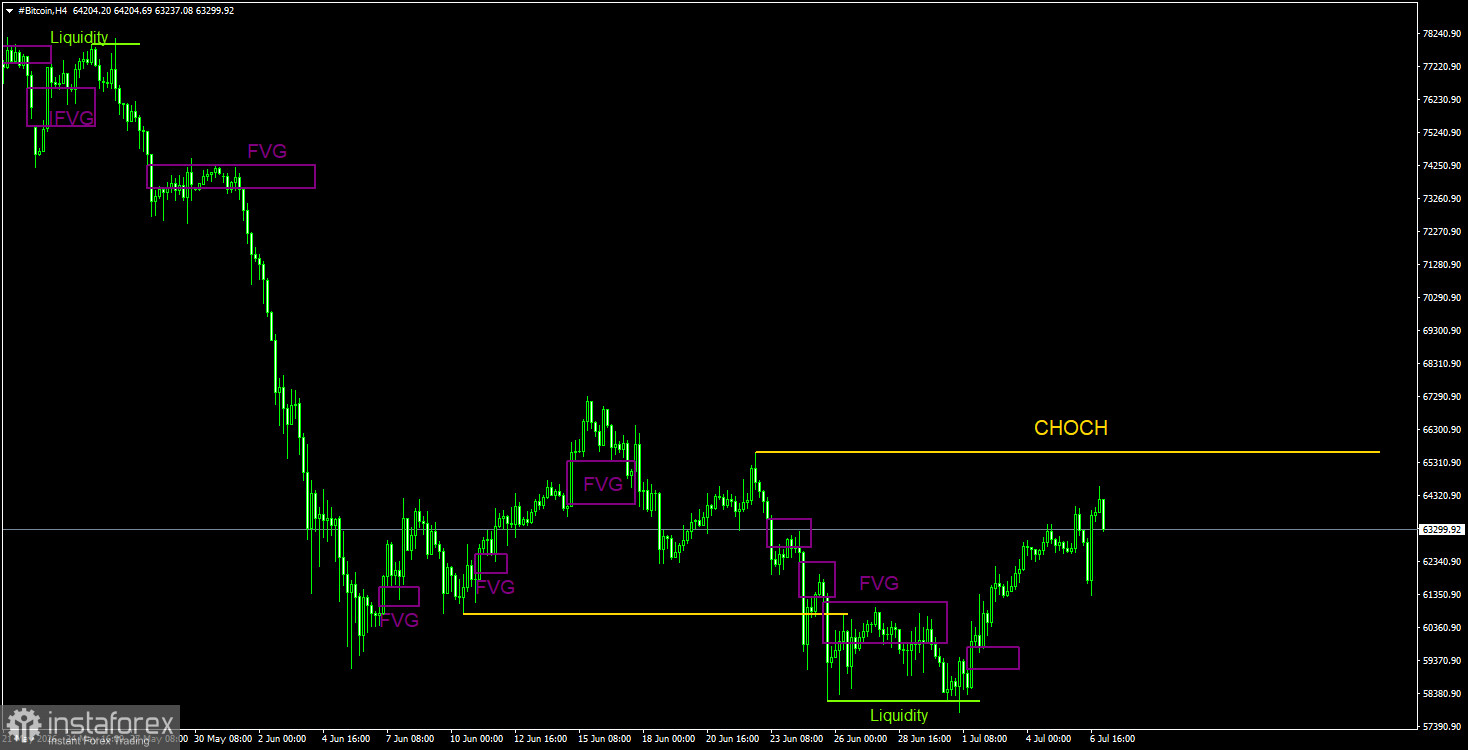
Trading recommendations for BTC/USD
Bitcoin continues to form a full bearish trend. We still expect a decline targeting $57,500 (the 61.8% Fibonacci level of the three?year uptrend), although this level has essentially already been worked through. We do not believe the downtrend will end there. The last bearish FVG pattern formed in the $68,000–$70,700 area on the daily timeframe, so this area acts as a POI for short positions in the coming weeks. On the 4?hour timeframe, Bitcoin has begun a new corrective leg, but sell trades still look more attractive. There are no active patterns on the 4?hour chart at the moment.
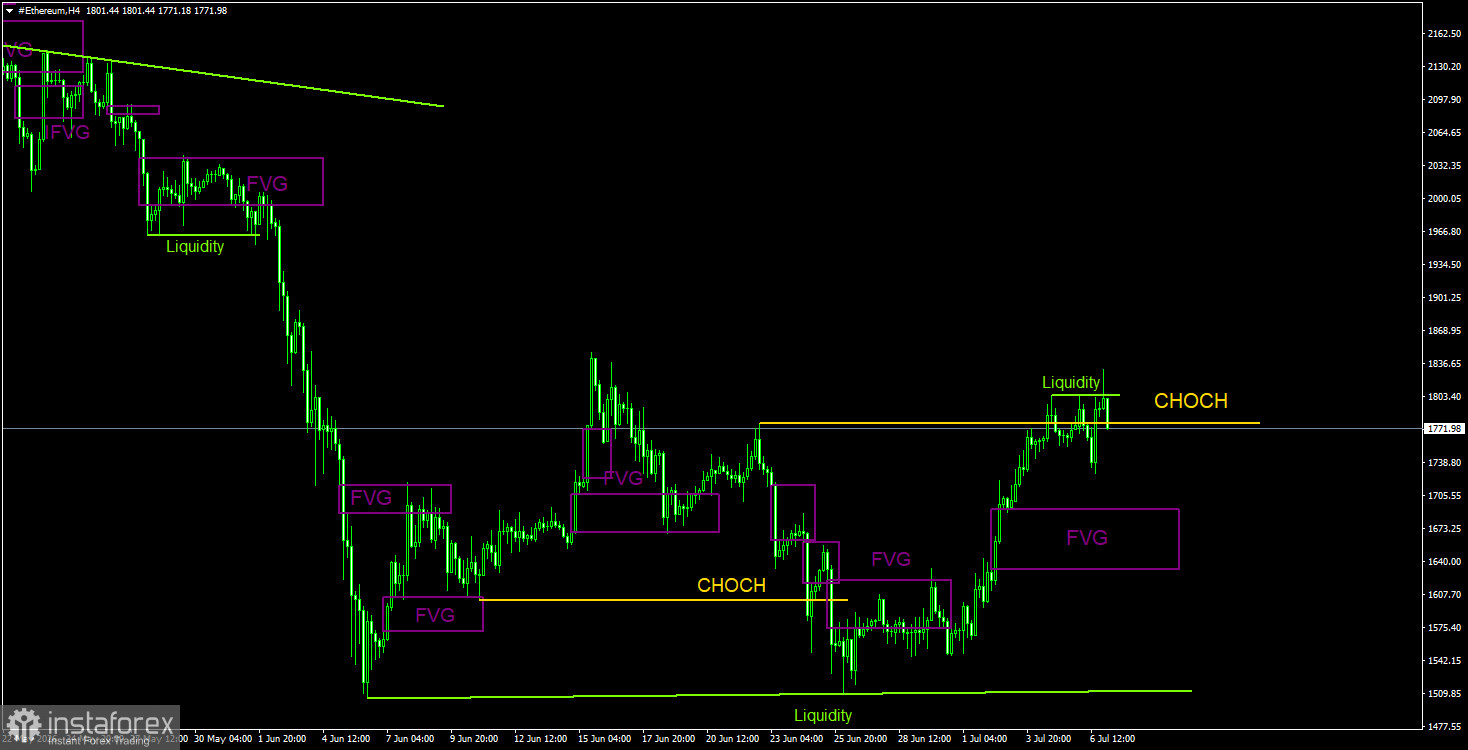
Trading recommendations for ETH/USD
A downtrend that began in August last year continues on the daily timeframe. The key sell pattern remains the bearish order block on the weekly timeframe. We do not believe the current downtrend is over, as there are no signs of its completion for either Bitcoin or Ethereum. Ethereum has resumed its decline with targets of $1,391 and $788, but the market is currently pausing in a daily?timeframe flat/range. Therefore, in the near term, we would watch for deviations above the upper band of the sideways channel to open shorts with targets of $1,680 and $1,505. On the 4?hour chart, Ethereum is near the upper band of the flat and has taken out sell?side liquidity. A drop for the second?largest cryptocurrency is possible in the near term.
Comments on the charts
CHOCH is a change of character / break of the trend structure. Liquidity means traders' Stop?Losses that market?makers use to build their positions. FVG is Fair Value Gap (area of price inefficiency). The price often moves quickly through such areas, indicating the absence of one side in the market. Later, the price tends to return and react to these zones. IFVG stands for Inverted Fair Value Gap. After a return to such a zone, the price does not react but impulsively breaks through and then tests it from the other side.
OB means Order Block. A candle on which a market?maker opened a position in order to harvest liquidity and then form their own position in the opposite direction.