 English
 Русский
 Bahasa Indonesia
 Bahasa Malay
 ไทย
ไทย Español
 Deutsch
 Български
 Français
 Tiếng Việt
 中文
中文 বাংলা
বাংলা हिन्दी
 Čeština
 Українська
 Română


The S&P 500 wiped out early gains and closed in the red: declines in Apple and Tesla outweighed other gains. Eight of 11 S&P sectors finished lower, led by healthcare and materials; tech and energy held up.
Dynamics of stock indices
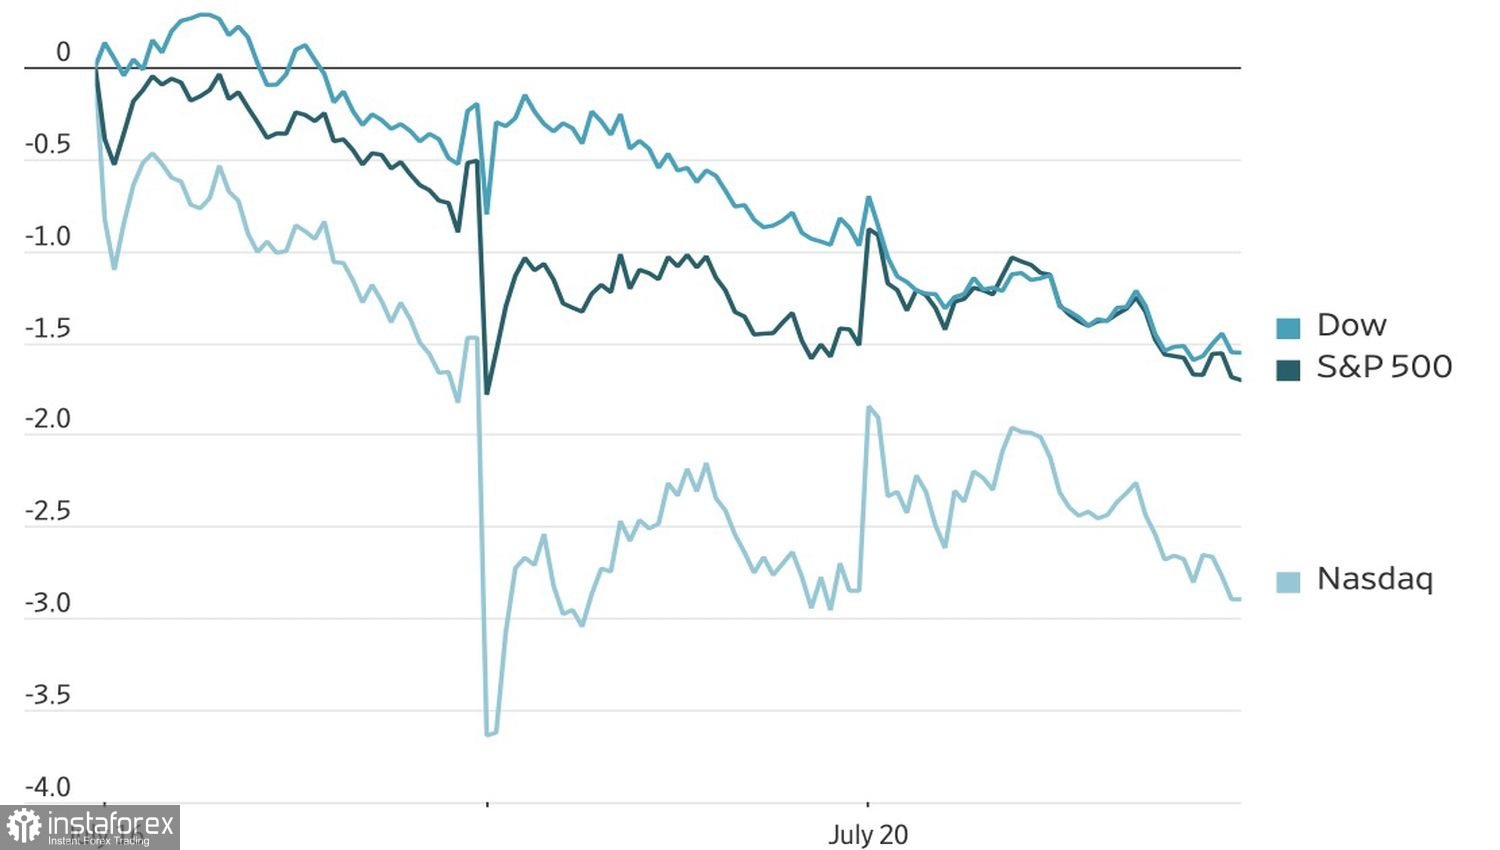
Summer thinness is showing: volumes are roughly 20% below the 30-day average. The equal-weighted S&P 500 fell by 0.5%, and decliners nearly doubled advancers. Market breadth is weakening behind the facade of record chip stocks.
Investors are jittery over competition in AI. Alibaba unveiled its Qwen 3.8 Max model at 2.4 trillion parameters, calling it second only to Anthropic's Fable 5. The market response was muted, unlike last Friday's sell-off after Moonshot AI announced Kimi K3. Citi Research notes that long-term success in AI requires enormous resources and a loyal client base — capabilities that firms like Alibaba possess.
Beneath the surface, something more worrying is building. Goldman Sachs data shows that hedge funds have been selling tech stocks at record speed: six of the last eight weeks, they were net sellers of the sector, trimming aggregate positions by about 10%, marking the largest retreat since this series began more than a decade ago. Analysts are already pointing to signs of capitulation.
Geopolitics adds to internal risks: prolonged tensions around Iran could push oil higher, reignite inflation fears, and renew talk of Fed tightening.
Short-interest dynamics across equity indices
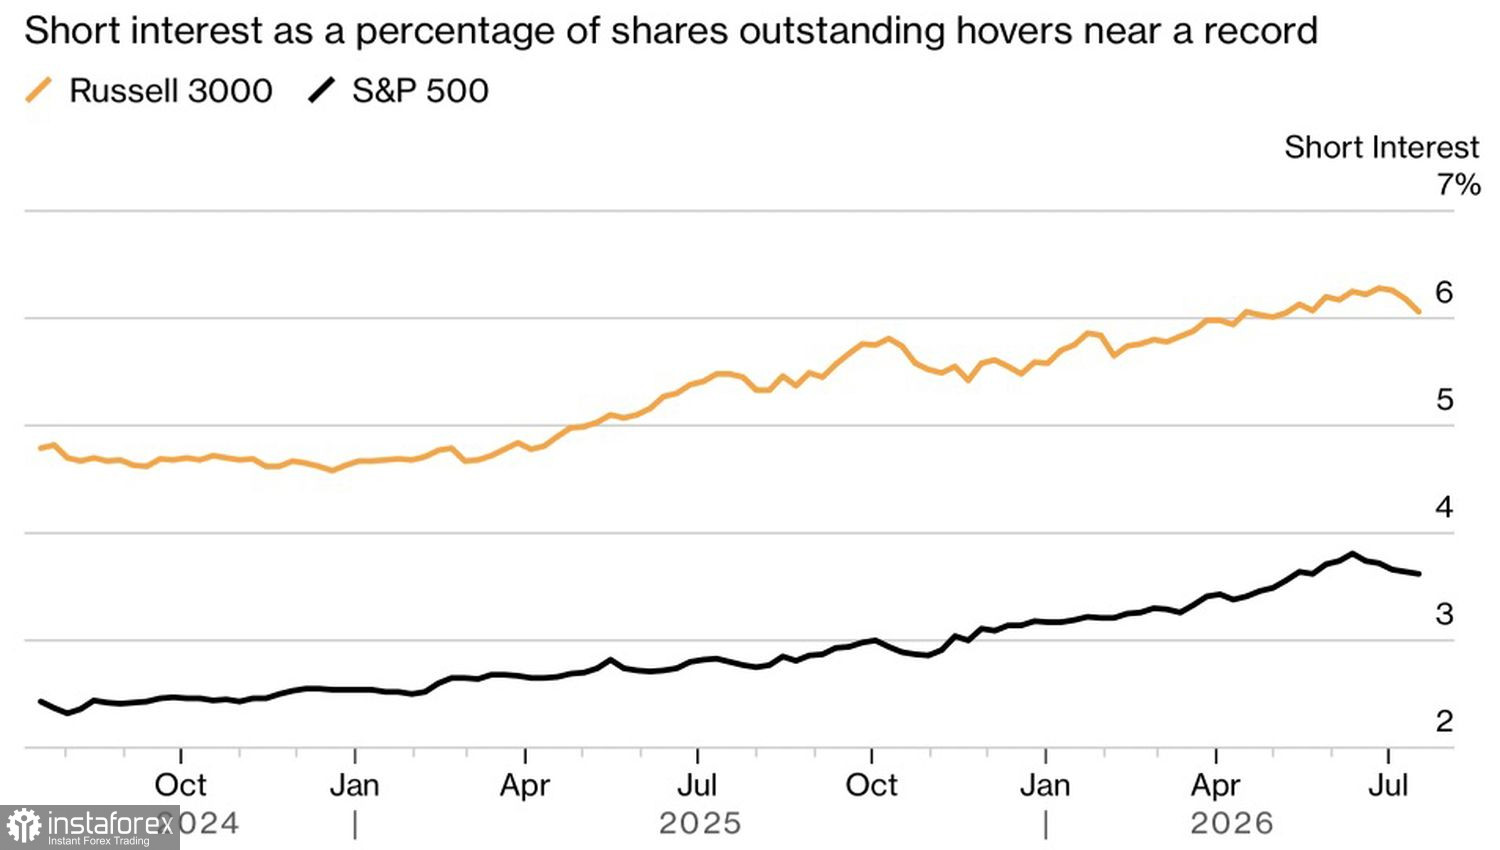
Investors face a busy five-day earnings stretch. Alphabet, Tesla, IBM, and Intel will reveal whether profits justify lofty expectations. Macro statistics are light, and Fed officials are quiet ahead of the July 29 policy decision. Who will win — bulls who pushed the index up 18% or bears with record shorts? The answer will likely come from earnings season.
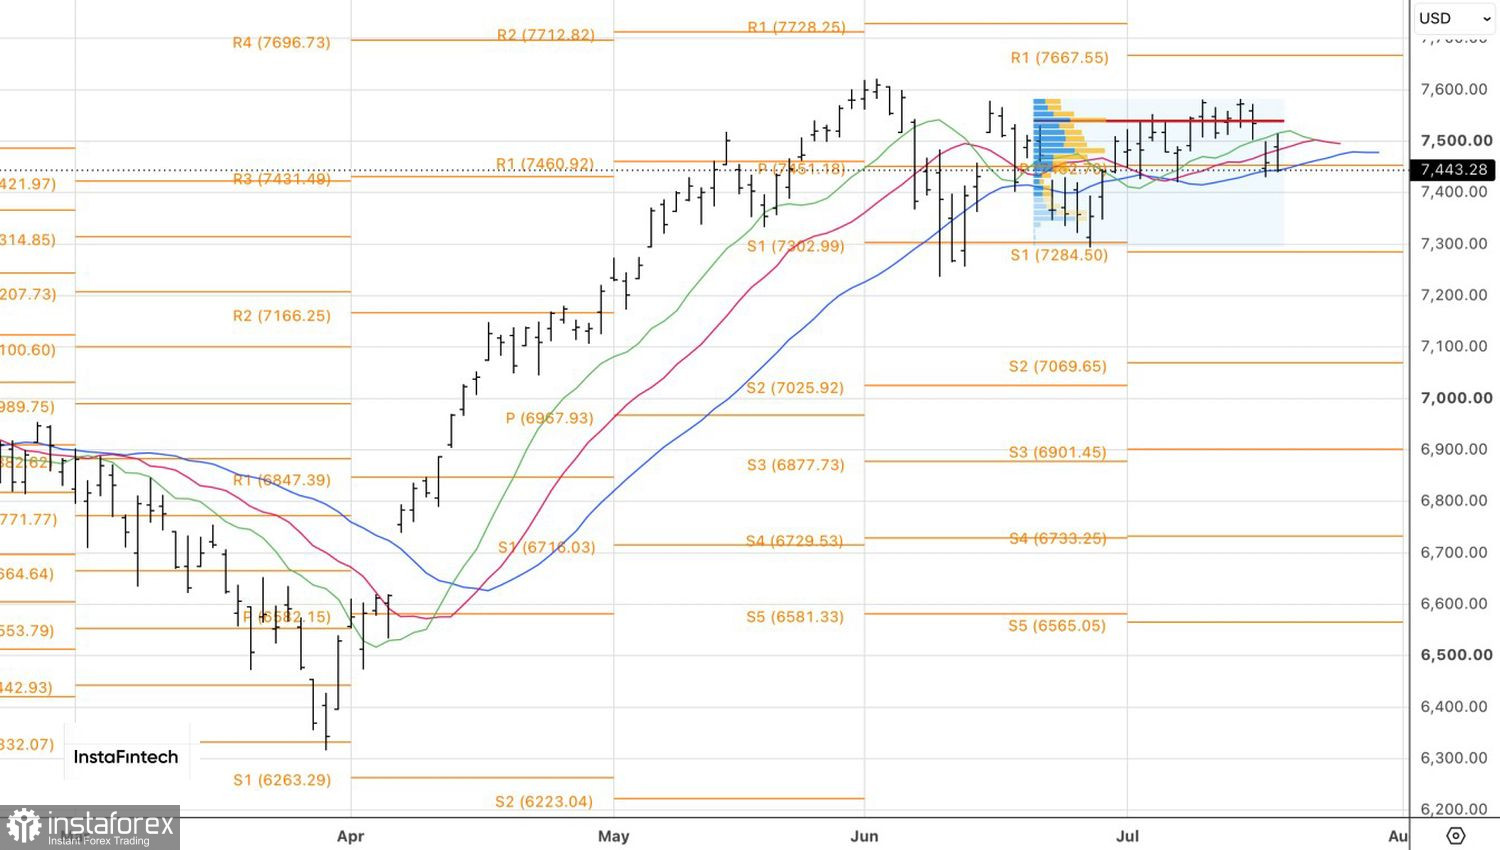
Technically, the daily chart shows that the S&P 500 is testing dynamic support levels in the form of key moving averages. Failure here would increase the risk of a correction and provide a technical sell trigger on a break of 7,425.