 English
 Русский
 Bahasa Indonesia
 Bahasa Malay
 ไทย
ไทย Español
 Deutsch
 Български
 Français
 Tiếng Việt
 中文
中文 বাংলা
বাংলা हिन्दी
 Čeština
 Українська
 Română


Analysis of Tuesday's Trades:
1H Chart of the EUR/USD Pair
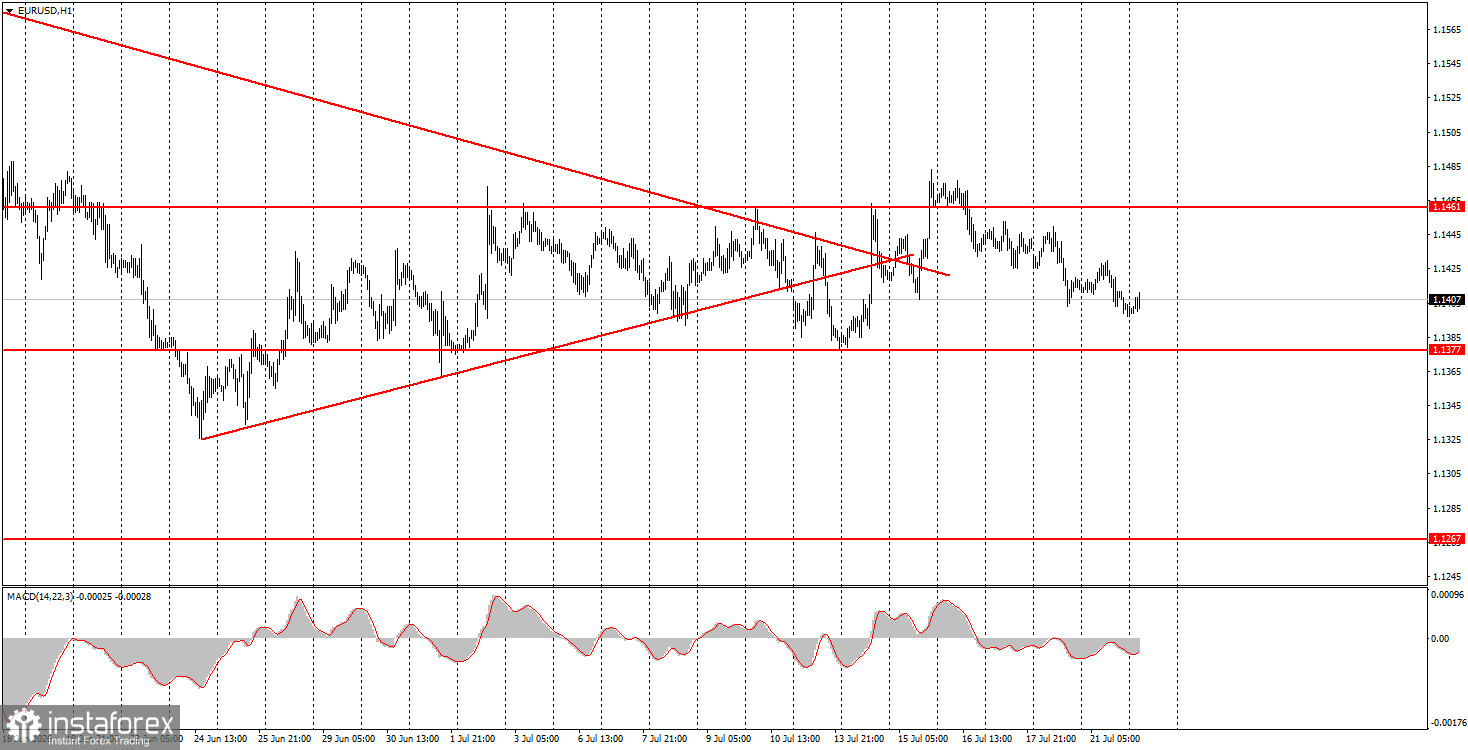
The EUR/USD currency pair continued its sluggish decline from the upper boundary of the horizontal channel to the lower one during Tuesday's trading. The macroeconomic background that day was very weak, limited to two ZEW reports for Germany and the Eurozone. Naturally, there was no market reaction to them, and volatility was again minimal. Thus, we continue to observe purely technical movements within the horizontal channel. After reaching the lower boundary of the channel at 1.1377-1.1461, a move back toward the upper boundary may begin. Tomorrow, the European Central Bank will meet, but this event may also have no impact on market sentiment. The ECB is highly likely to leave rates unchanged, so traders will have nothing to react to. The flat for the euro currency has been ongoing for almost a month, and there is nothing to be done about it.
5M Chart of the EUR/USD Pair
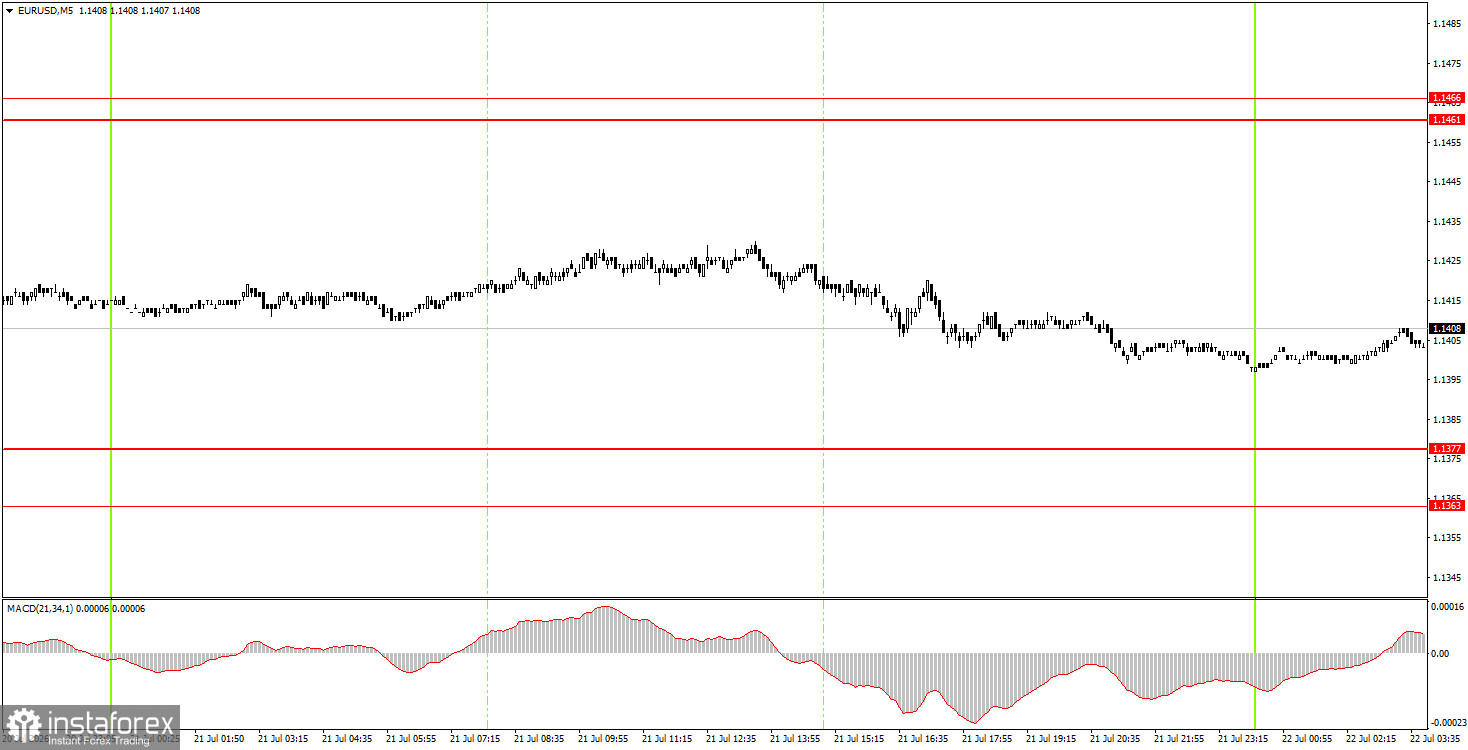
On the 5-minute timeframe, there were no trading signals formed on Tuesday. Movements were again weak, and the price failed to work through any of the levels or areas. Thus, there were again no grounds for beginners to enter the market.
How to Trade on Wednesday:
On the hourly timeframe, both trend lines have been broken and are no longer relevant. Considering all the events and movements in the market in recent months, we believe the euro should show confident growth—much stronger than in recent weeks. However, in reality, the current upward movement is merely a correction, and in recent weeks, the movement looks much more like a flat than a trend.
On Wednesday, novice traders can open short positions with targets of 1.1325 and 1.1267 if the price consolidates below the area of 1.1363-1.1377. Long positions can be opened with a target of 1.1461-1.1466 if the price bounces off the area of 1.1363-1.1377. We would still not anticipate strong movements.
On the 5-minute timeframe, levels to consider are 1.1267-1.1275, 1.1363-1.1377, 1.1461-1.1466, 1.1527-1.1531, 1.1584-1.1594, 1.1655-1.1666, 1.1745-1.1754. On Wednesday, there are no important events or publications scheduled in the Eurozone and the US. Therefore, movements today may again be weak, and the flat is likely to continue.
Basic Rules of the Trading System:
- The strength of a signal is determined by the time it takes to form (a bounce or a breakout). The less time it took, the stronger the signal.
- If two or more trades were opened at a particular level on false signals, all subsequent signals from that level should be ignored.
- In a flat, any pair can form many false signals or none at all. Technical levels may be ignored.
- On the hourly timeframe, trading signals from the MACD indicator should be executed only when volatility is good, and a trend is confirmed by a trend line or channel.
- If two levels are too close together (5 to 20 pips), they should be considered a support or resistance area.
- After moving 15 pips in the correct direction, a Stop Loss should be placed at breakeven.
What's on the Charts:
Price levels (areas) of support and resistance are targets when opening long or short positions or sources of signals.
Red lines indicate channels or trend lines that display the current trend and indicate the preferred direction for trading.
The MACD indicator (14,22,3) – histogram and signal line – is a supplementary indicator that can also be used as a source of signals.
Important speeches and reports (contained in the news calendar) can significantly impact the movement of the currency pair. Therefore, during their release, trading should be conducted with maximum caution, or one should exit the market to avoid sharp reversals against preceding movements.
Beginners trading in the forex market should remember that not every trade can be profitable. Developing a clear strategy and practicing money management are key to long-term success in trading.