 English
 Русский
 Bahasa Indonesia
 Bahasa Malay
 ไทย
ไทย Español
 Deutsch
 Български
 Français
 Tiếng Việt
 中文
中文 বাংলা
বাংলা हिन्दी
 Čeština
 Українська
 Română


The GBP/USD currency pair traded quite calmly on Wednesday until the evening when the results of the Federal Reserve meeting were announced. As we will analyze today, the Bank of England's meeting will also take place today. It is worth reminding traders that they barely noticed the outcomes of the previous meeting. Formally, the results appeared slightly more hawkish due to a larger-than-expected number of votes "for" a rate hike. Nevertheless, the pound did not show any growth a month and a half ago. The last two European Central Bank meetings were also ignored by traders. It's not hard to assume that what matters to traders now is primarily the Fed's monetary policy and, to some extent, geopolitics.
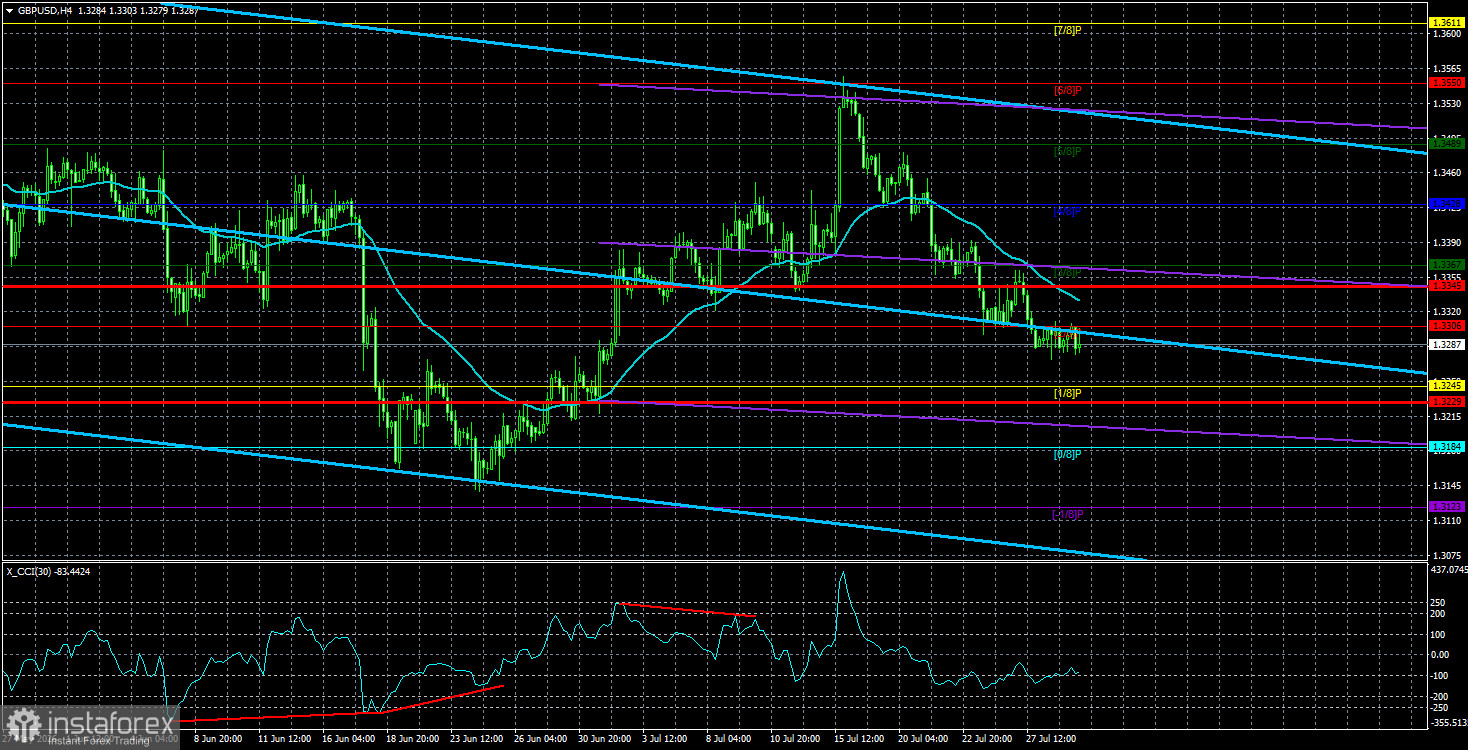
Geopolitics has not changed over time, while the market is literally demanding tightening from the Fed. Moreover, the tightening process began a month and a half ago. Since then, the British pound has shown decent growth but is now falling again. The current movements in the GBP/USD pair can best be seen on the daily timeframe. Essentially, it's a "swing". The price has been in a limited range for a year and has frequently changed direction. The weekly timeframe clearly shows a flat. Such "swings" should not surprise anyone. We still believe that after testing the lower boundary of the channel at 1.3150-1.3780, an upward movement has begun. The recent decline in quotes over the past two weeks is just a typical correction. Yes, corrections also occur within a flat. In fact, this happens all the time.
Returning to the BoE, there is a 100% probability that the British central bank will leave the key rate unchanged, as there are currently no reasons to raise it. In the US, inflation is at 3.5%, and the Fed is contemplating tightening. In the UK, inflation has dropped to 2.6%, leading the BoE to consider resuming monetary policy easing. Thus, the intrigue of today's meeting will be whether the BoE signals its willingness to resume rate cuts in 2026.
Of course, geopolitical uncertainty also concerns the BoE. However, the UK has navigated the energy crisis relatively easily, so a new rise in energy prices is unlikely to provoke a significant acceleration in inflation. Easing from the BoE clearly does not align well with a potential Fed tightening. Judging solely by this factor, the dollar is in a much better position than the pound. However, there is one "but." The Fed has yet to begin tightening policy, and the market has been pricing in this scenario for a month and a half. The flat on the weekly timeframe remains regardless. Therefore, we do not believe that the British pound will start or has already started a new global downward trend. However, in the medium term, it may come under pressure due to complex geopolitical factors and a more hawkish stance by the Fed than by the BoE.
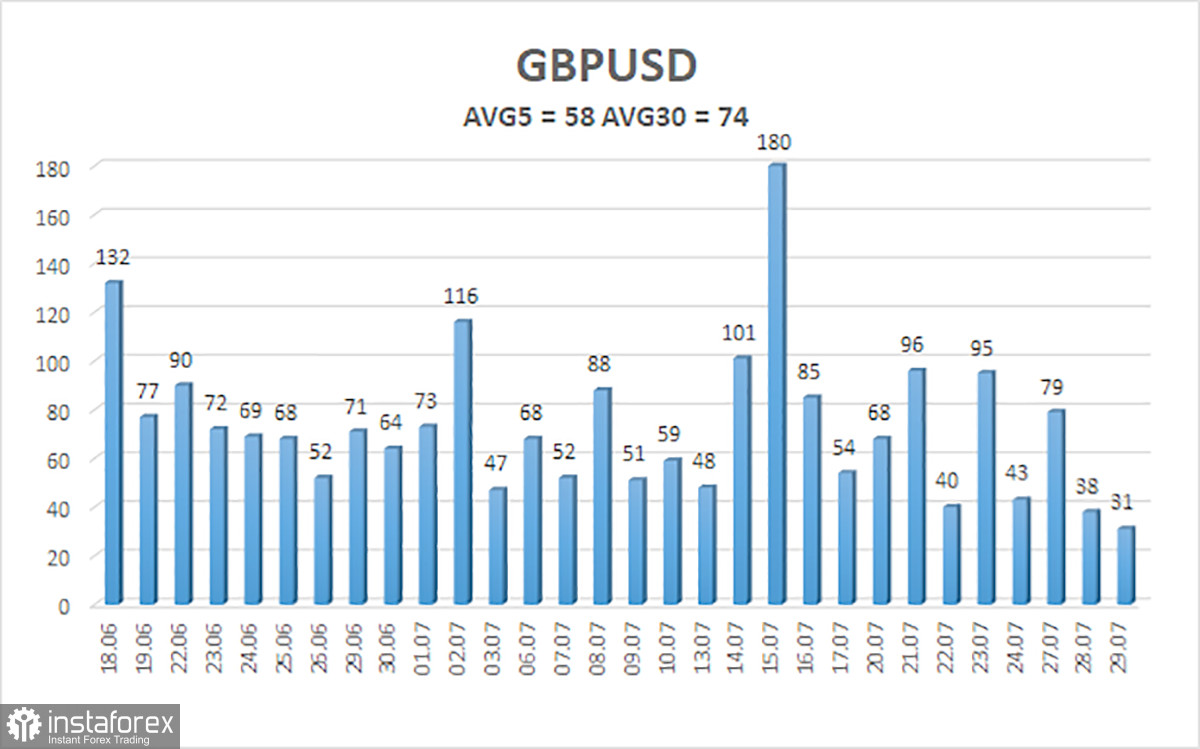
The average volatility of the GBP/USD pair over the last 5 trading days is 58 pips, which is characterized as "medium-low." On Thursday, July 30, we expect movement within a range bounded by 1.3229 and 1.3345. The upper channel of the linear regression is directed downward, indicating a bearish trend. The CCI indicator has formed a bearish divergence and has entered the overbought area, signaling the onset of a downward correction.
Nearest Support Levels:
S1 – 1.3245
S2 – 1.3184
S3 – 1.3123
Nearest Resistance Levels:
R1 – 1.3306
R2 – 1.3367
R3 – 1.3428
Trading Recommendations:
The GBP/USD currency pair maintains an upward trend. Donald Trump's policies will continue to exert pressure on the US economy, so we do not expect the US currency to appreciate in the long term. The year 2026 is currently looking very positive for the dollar due to geopolitics, but every fairy tale has its end. However, on the weekly timeframe, a flat persists between 1.3150 and 1.3780 within a four-year upward trend, supporting expectations of continued growth for the British currency in the medium term.
Long positions with targets at 1.3428 and 1.3489 can be considered when the price is above the moving average. If the price is below the moving average line, trading for a decline can be considered with targets at 1.3245 and 1.3229.
Explanations for Illustrations:
- Linear regression channels help determine the current trend. If both are directed in the same way, it indicates a strong trend;
- The moving average line (settings 20,0, smoothed) defines the short-term trend and the direction in which trading should currently be conducted;
- Murray levels indicate target levels for movements and corrections;
- Volatility levels (red lines) indicate the probable price channel in which the pair will spend the next day based on current volatility indicators;
- The CCI indicator — its entry into the oversold area (below -250) or overbought area (above +250) indicates that a trend reversal in the opposite direction is approaching.