 English
 Русский
 Bahasa Indonesia
 Bahasa Malay
 ไทย
ไทย Español
 Deutsch
 Български
 Français
 Tiếng Việt
 中文
中文 বাংলা
বাংলা हिन्दी
 Čeština
 Українська
 Română


Bitcoin and Ethereum returned to a downward trend at the beginning of August, although they performed quite well in July.

July was a paradoxical month for the crypto market. Bitcoin started the month at around $60,000 and ended it near $64,200, gaining about 9%. Ethereum showed a performance twice as strong, rising from approximately $1,600 to nearly $1,920, which is about 20%, marking its best monthly return of the year. Meanwhile, the Fear and Greed Index remained at 28 in the "fear" zone on the very day Ethereum recorded that twenty percent monthly gain. The gap between price movements and overall market sentiment became a defining feature of the month; investors experienced one of the year's strongest surges but continued to behave as if the market remained under threat.
Even more interesting is the source of this growth. The inflow into the Ethereum ETF during the week from July 24 to 30 was negative, around -$69.7 million according to Farside, despite the asset showing its best price for the month. In other words, Ethereum's rise did not stem from traditional institutional demand via American spot funds, but rather from on-chain accumulation and corporate treasury demand. This model was systematically demonstrated by Bitmine, which methodically increased its position to 5.79 million coins right amid overall market anxiety. Bitcoin ETFs, during the same period, lost about $200 million, reinforcing the notion of a market driven by a narrow circle of convinced buyers rather than a broad retail base, which typically confirms the sustainability of a rally.
However, investor caution is based on very rational grounds. The Federal Reserve maintained its rate in the 3.50-3.75% range on July 29, but the hawkish tone of the Fed chair and the 9-3 split vote kept traders on edge heading into August.
Regarding short-term trading, the strategy and conditions are described below.
Bitcoin
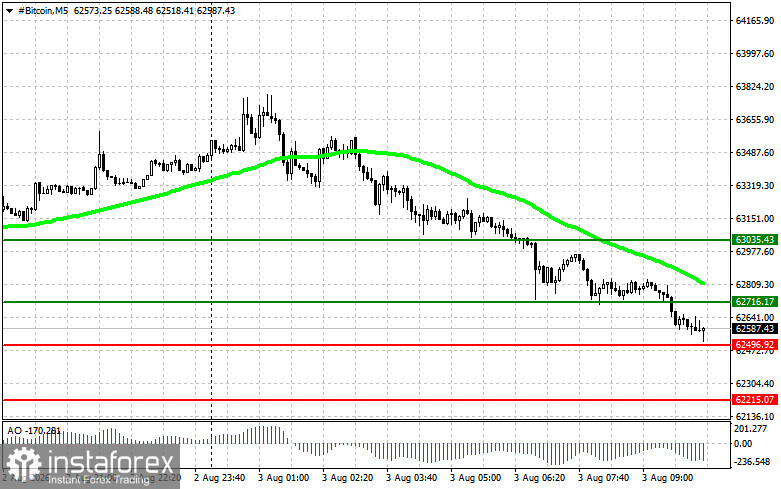
Buy Scenario
Scenario #1: I will buy Bitcoin today upon reaching the entry point around $62,700 with a target growth to the level of $63,000. Around $63,000, I will exit the buy positions and sell immediately on the bounce. Before buying on a breakout, ensure that the 50-day moving average is below the current price, and the Awesome indicator is above zero.
Scenario #2: I can buy Bitcoin at the lower boundary of $62,400 if there is no market reaction to its breakout back towards $62,700 and $63,000.
Sell Scenario
Scenario #1: I will sell Bitcoin today upon reaching the entry point around $62,400 with a target drop to the level of $62,200. Around $62,200, I will exit the sell positions and buy immediately on the bounce. Before selling on a breakout, ensure that the 50-day moving average is above the current price, and the Awesome indicator is below zero.
Scenario #2: I can sell Bitcoin at the upper boundary of $62,700 if there is no market reaction to its breakout back towards $62,400 and $62,200.
Ethereum
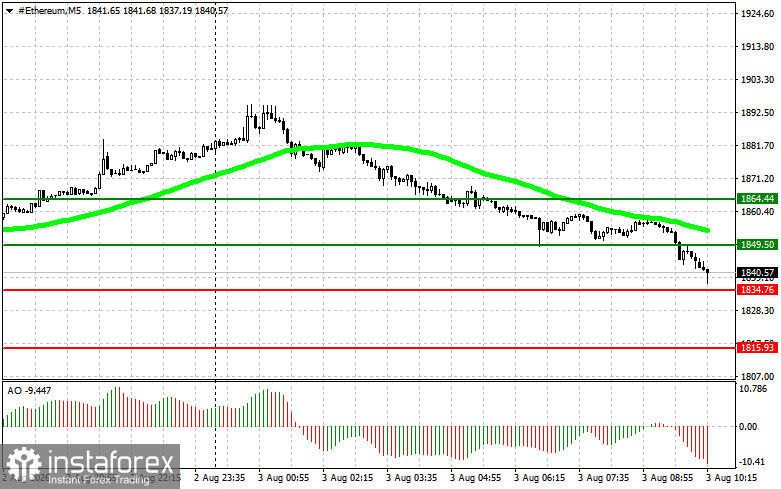
Buy Scenario
Scenario #1: I will buy Ethereum today upon reaching the entry point around $1,849 with a target growth to the level of $1,864. Around $1,864, I will exit the buy positions and sell immediately on the bounce. Before buying on a breakout, ensure that the 50-day moving average is below the current price, and the Awesome indicator is above zero.
Scenario #2: I can buy Ethereum at the lower boundary of $1,834 if there is no market reaction to its breakout back towards $1,849 and $1,864.
Sell Scenario
Scenario #1: I will sell Ethereum today upon reaching the entry point around $1,834 with a target drop to the level of $1,815. Around $1,815, I will exit the sell positions and buy immediately on the bounce. Before selling on a breakout, ensure that the 50-day moving average is above the current price, and the Awesome indicator is below zero.
Scenario #2: I can sell Ethereum at the upper boundary of $1,849 if there is no market reaction to its breakout back towards $1,834 and $1,815.