 English
 Русский
 Bahasa Indonesia
 Bahasa Malay
 ไทย
ไทย Español
 Deutsch
 Български
 Français
 Tiếng Việt
 中文
中文 বাংলা
বাংলা हिन्दी
 Čeština
 Українська
 Română


Long positions should only be considered on a sustained breakout above 7,780.0. Short positions could only be considered on a break below 7690.0 confirmed by fundamental factors. It is highly recommended to use stop-loss orders due to elevated volatility.
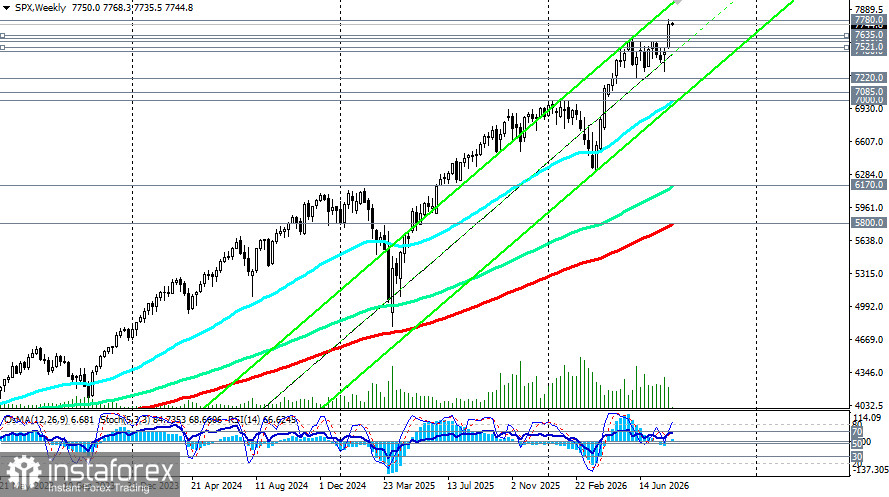
The S&P 500 is currently at record highs, where a strong fundamental backdrop (record earnings season, upward profit revisions) meets macroeconomic uncertainty (inflation data, Fed rate expectations). The key event of the week will be Wednesday's CPI data, which could determine whether the index can hold above 7,800.0 and continue toward 7,900.0-8,000.0 or reverse toward the support zone of 7,635.0-7,580.0.
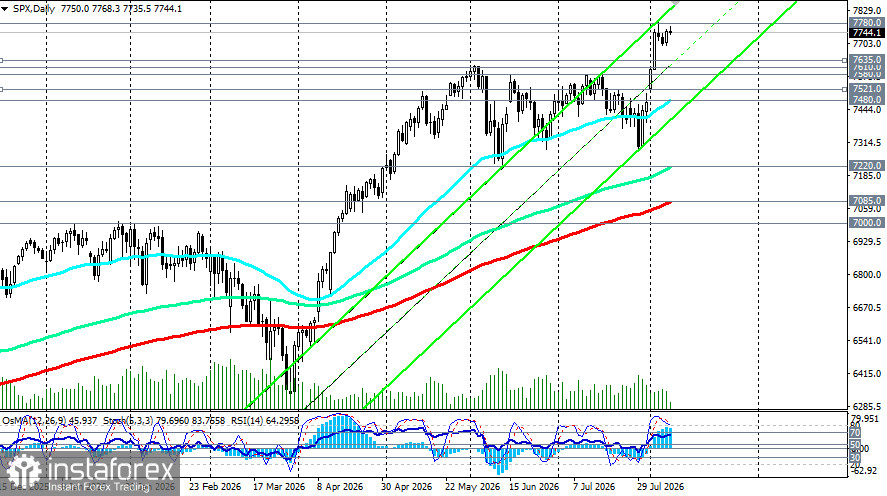
From a technical standpoint, the S&P 500 maintains bullish momentum, consolidating above key moving averages:
- The EMA50 is around 7,480.0, acting as the nearest strong dynamic support. The index is holding firmly above this level, confirming the continuation of the short-term bullish trend.
- The EMA200 is at 7,085.0, creating a key support zone alongside the 50-period weekly average at 7,000.0.
Daily chart indicators confirm the continuation of bullish price momentum:
- The RSI (14) is in the 64-65 range, indicating moderate upside momentum without signs of overbought conditions (above 70). This leaves room for further gains.
- The OsMA histogram remains in positive territory (value 46), confirming continued bullish momentum.
- The Stochastic oscillator is in overbought territory, confirming strong bullish momentum.
The nearest resistance is at 7,780.0 (local high), and a break above this level could serve as the earliest signal for new long positions.
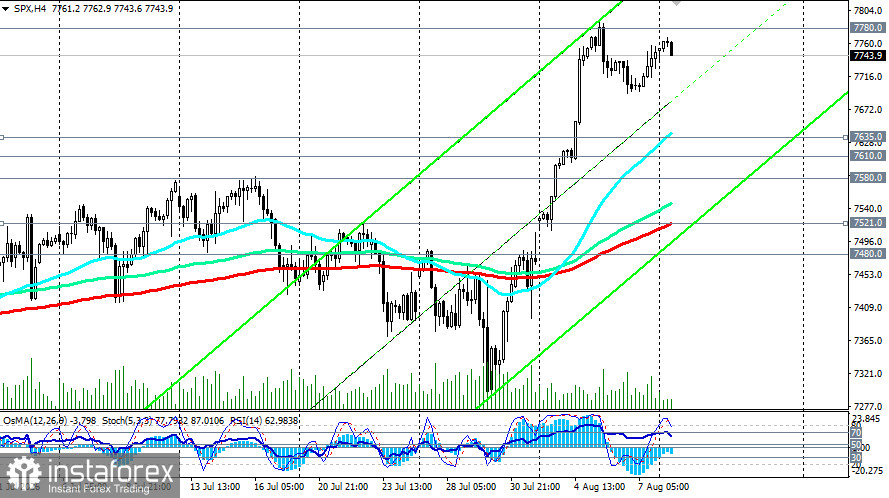
Conditions for realization:
- A sustained break above the resistance level of 7,780.0 and consolidation above the psychological level of 7,800.0.
- Weak US CPI inflation data (below the 3.4% y/y forecast), fully removing expectations of a Fed rate hike.
- Progress in US-Iran negotiations and a further reduction in geopolitical tensions.
- Strong earnings prints and positive profit forecasts.
- Technical confirmation: RSI above 65, accelerating OsMA growth.
Target zone: 7,800.0 (psychological level), 7,850.0 (upper boundary of the ascending channel and the next significant barrier), 8,000.0.
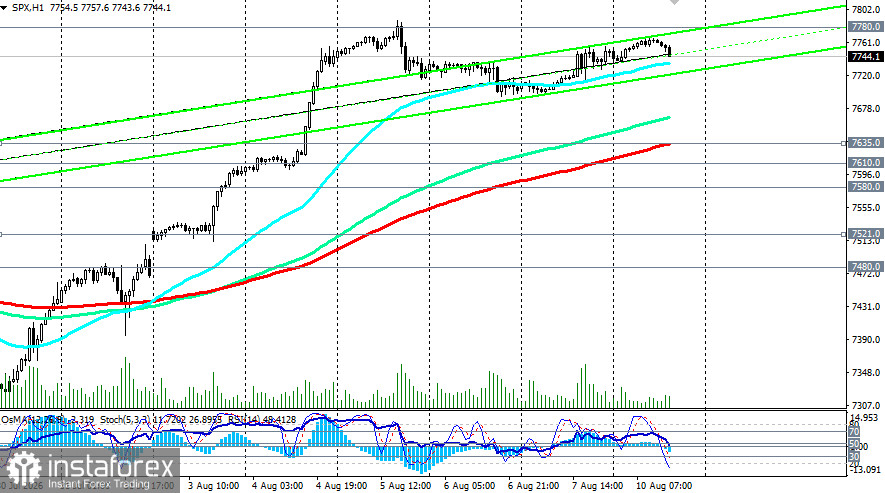
Nearest support: 7,700.0-7,690.0 (local support). A break below this level and further decline could trigger the alternative bearish scenario. The nearest downside targets are 7,635.0 (EMA200 on the 1-hour chart), 7,610.0-7,580.0 (next local support and former resistance levels).
A confident break below 7,580.0 could trigger a deeper correction with the nearest targets at the support levels of 7,480.0 (daily EMA50), 7,300.0, 7,225.0 (June low), 7,220.0 (daily EMA144). At the same time, from the 7,220.0 and 7,200.0 levels, one can anticipate a rebound and enter long positions at more favorable prices, provided that the bullish price momentum remains intact.
Conditions for bearish scenario:
- Reversal from the resistance level of 7,780.0 and a break below the support level of 7,480.0 (50-EMA).
- Strong US CPI inflation data (above forecast), reviving expectations of a Fed rate hike in September.
- Escalation of geopolitical tensions in the Middle East.Decline in corporate guidance or disappointment in AI investments.
- Technical confirmation: RSI below 50, OsMA crossing below the zero line.
Most likely scenario: consolidation in the 7,635.0–7,800.0 range, with an attempt to break the resistance level if the positive fundamental backdrop persists.
Logic
The market is paused in anticipation of key CPI and PPI inflation data, which could determine the index's next move.
The technical picture points to the preservation of bullish momentum, but the resistance level of 7,800.0 may limit upside in the near term.
Fundamental factors (strong earnings season, upward profit revisions) are providing solid support for the index.
Recommendation: cautious trading, with a preference for a wait-and-see stance until Wednesday's CPI release. Long positions should only be considered on a sustained breakout above 7,780.0. Short positions should only be considered on a break below 7690.0 confirmed by fundamental factors. It is highly recommended to use stop-loss orders due to elevated volatility.
Trading scenarios
- Bullish scenario: Buy Stop 7,790.0, 7,810.0. Stop-Loss 7,690.00. Targets 7,860.00, 7,900.00, 8,000.00
- Bearish scenario: Sell Stop 7,690.00. Stop-Loss 7,790.0. Targets 7,635.0, 7,610.0, 7,600.0, 7,580.0, 7,521.0, 7,500.0, 7,480.0, 7,400.0, 7,300.0, 7,220.0, 7,200.0, 7,100.0, 7,085.0, 7,000.0
Here, "Targets" correspond to support/resistance levels. This does not imply they will necessarily be reached but may serve as a guide for planning and positioning trades.