 English
 Русский
 Bahasa Indonesia
 Bahasa Malay
 ไทย
ไทย Español
 Deutsch
 Български
 Français
 Tiếng Việt
 中文
中文 বাংলা
বাংলা हिन्दी
 Čeština
 Українська
 Română


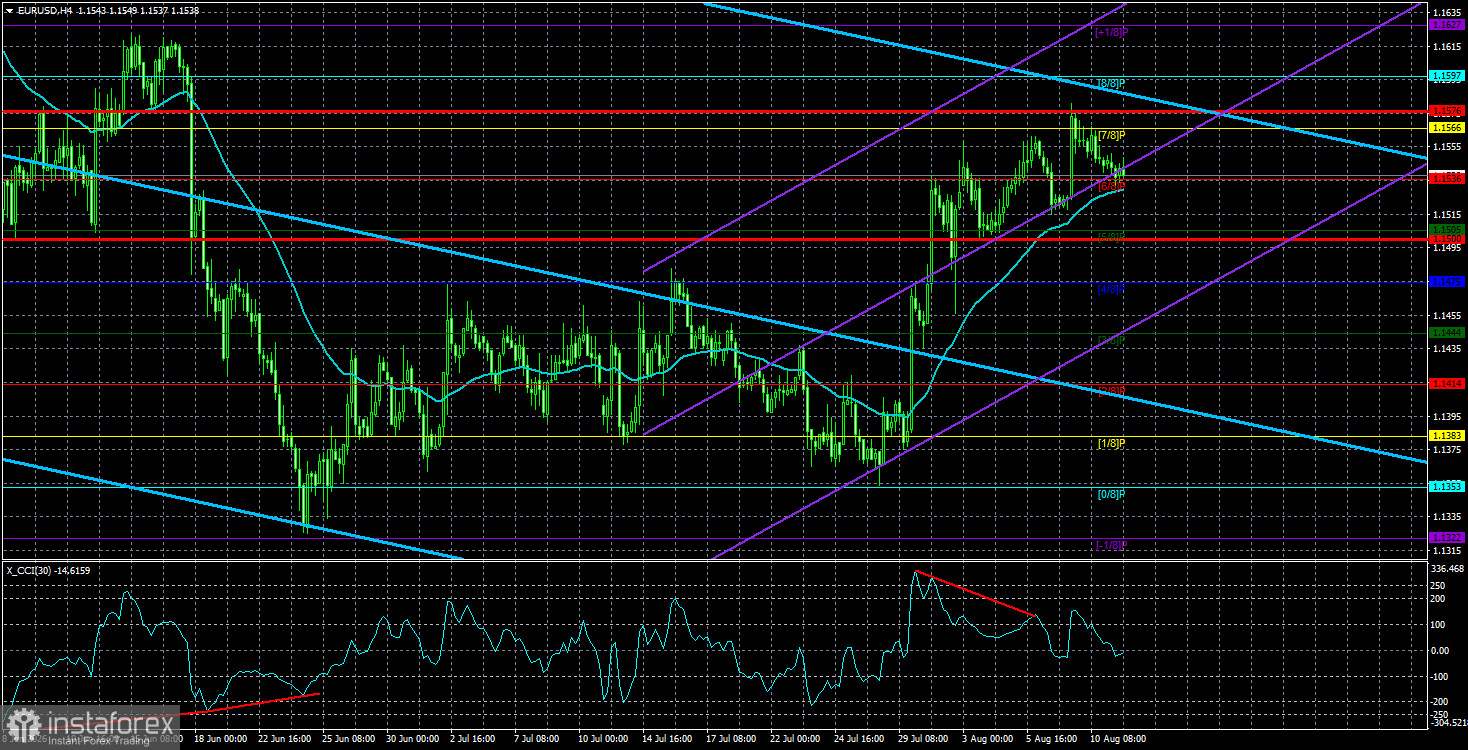
The EUR/USD currency pair retreated slightly from the highs reached earlier in the week, but overall traded rather ambiguously over the first two days of the week. On the one hand, a correction after a fairly strong rise is natural. On the other hand, last Friday's disappointing Nonfarm Payrolls are not just disappointing Nonfarm Payrolls. They are effectively a cross on the prospects of Federal Reserve tightening in September. And perhaps not only in September. The point is that, whatever the inflation level, raising the Fed's key rate will lead to an even greater slowdown in the labor market. Thus, by tightening monetary policy, the Fed will be fighting one problem and stimulating another.
Today the inflation report for July will be released, and it could well indicate that there is no need to tighten monetary policy right now. If US inflation falls for the second consecutive month (no matter by how much), the Fed will have no reason to rush. Why? Trump announces the reopening of the Strait of Hormuz every day, Iran has practically agreed with Oman on shipping routes through the strait, neither Trump nor Tehran wants to continue the war, and inflation is falling without central bank intervention. Of course, anything can go wrong at any time. The Strait of Hormuz could remain blocked for months or even years. Washington and Tehran are as far from a deal as the Sun is from the Moon. And inflation may slow in July and then rise again in August.
Therefore, in any case, conclusions will need to be drawn directly before the Fed's September meeting. However, there is still a whole month before the Fed meeting, and the market needs something to rely on when making trading decisions. Thus, we believe that any July slowdown in consumer prices will automatically mean the Fed will not raise the key rate in September. This conclusion may change in September when new Nonfarm Payrolls and unemployment data are released, but until September the main scenario will be rate preservation.
How might the dollar react to the inflation report? It's relatively simple. The lower inflation is relative to June, the more likely the dollar is to fall, and the fewer chances there are of seeing at least one Fed tightening before year-end. The higher inflation is relative to the 3.4% forecast, the better the dollar will feel; however, the probability of tightening will not rise significantly, because labor market conditions — which have quietly reverted to 2025 trends — will now be the primary concern. As a result, the dollar will not, in any case, receive strong and lasting market support. A correction is possible, but over the next few weeks we still expect the euro to rise. In the longer term — a resumption of the global uptrend.
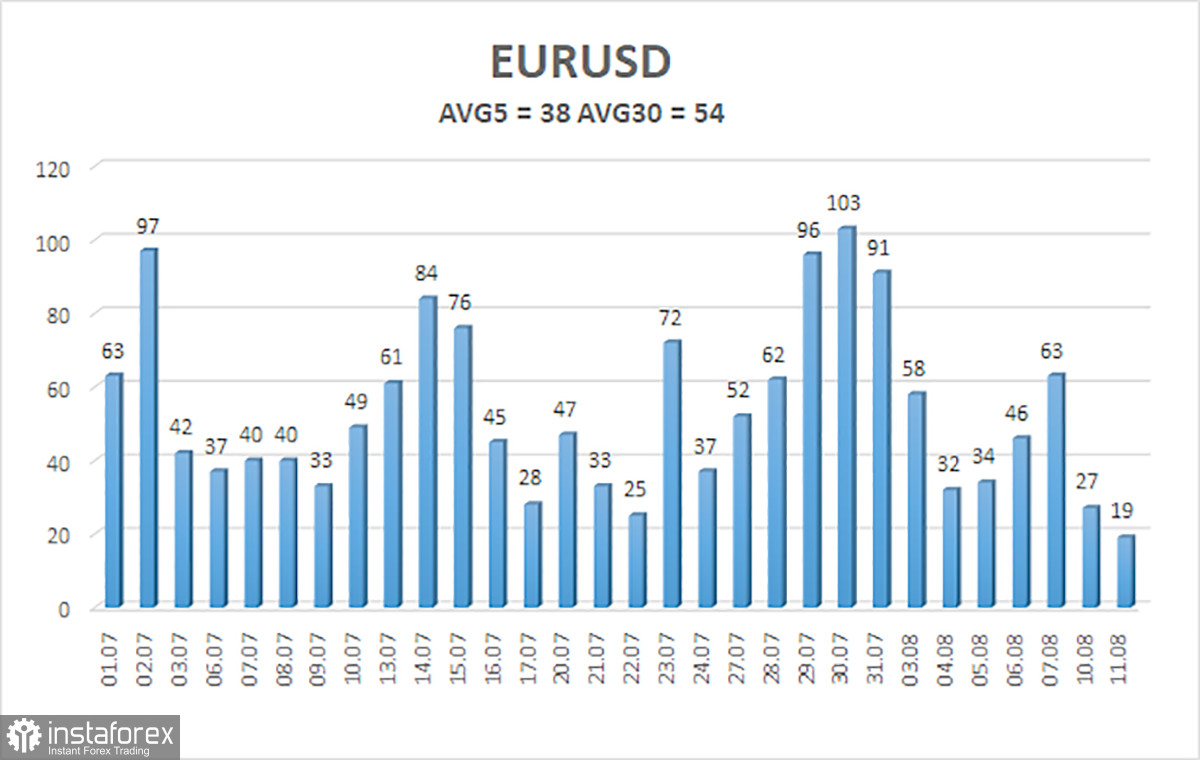
The average volatility of the EUR/USD currency pair over the last 5 trading days as of August 12 is 38 pips and is characterized as "low." We expect the pair to move between 1.1500 and 1.1576 on Wednesday. The upper linear regression channel is directed downward, indicating the persistence of a downward tendency. The CCI indicator entered the overbought area and formed a "bearish" divergence, warning of a possible downside retracement.
Nearest support levels:
S1 – 1.1536
S2 – 1.1505
S3 – 1.1475
Nearest resistance levels:
R1 – 1.1566
R2 – 1.1597
R3 – 1.1627
Trading Recommendations:
The EUR/USD pair continues an uptrend on the 4-hour TF, which may be the beginning of a new leg of a global uptrend on higher TFs. The global fundamental backdrop for the dollar remains negative, but in 2026, geopolitics first, and then the Fed's hawkish stance, provided strong support for the US currency. However, every fairy tale eventually ends. If the price is below the moving average, shorts can be considered with targets at 1.1500 and 1.1475. Above the moving average, long positions are relevant with targets at 1.1576 and 1.1597.
Explanations to the illustrations:
- Linear regression channels help determine the current trend. If both are directed the same way, the trend is currently strong;
- The moving average line (settings 20,0, smoothed) defines the short-term tendency and the direction in which trading should be conducted now;
- Murray levels — target levels for moves and corrections;
- Volatility levels (red lines) — the likely price channel in which the pair will trade over the next 24 hours, based on current volatility indicators;
- The CCI indicator — its entry into the oversold area (below -250) or the overbought area (above +250) signals that a trend reversal to the opposite side is approaching.