 English
 Русский
 Bahasa Indonesia
 Bahasa Malay
 ไทย
ไทย Español
 Deutsch
 Български
 Français
 Tiếng Việt
 中文
中文 বাংলা
বাংলা हिन्दी
 Čeština
 Українська
 Română


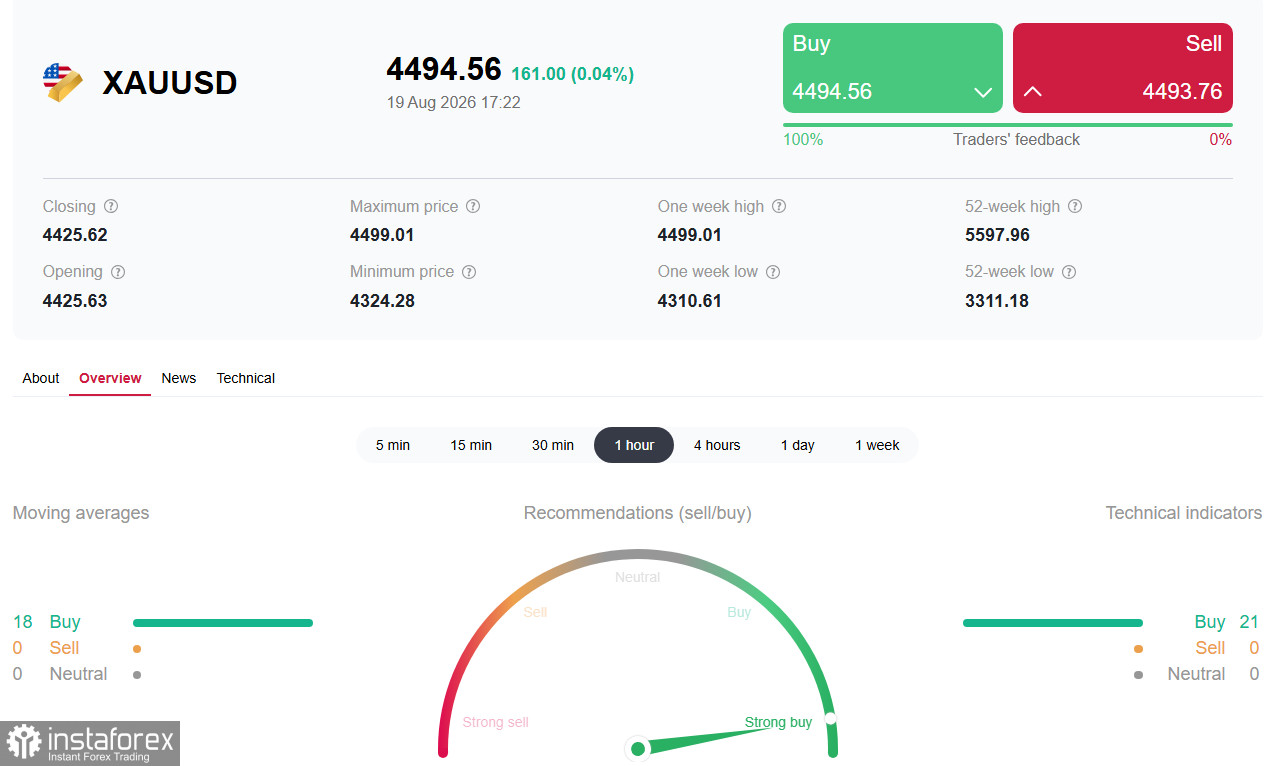
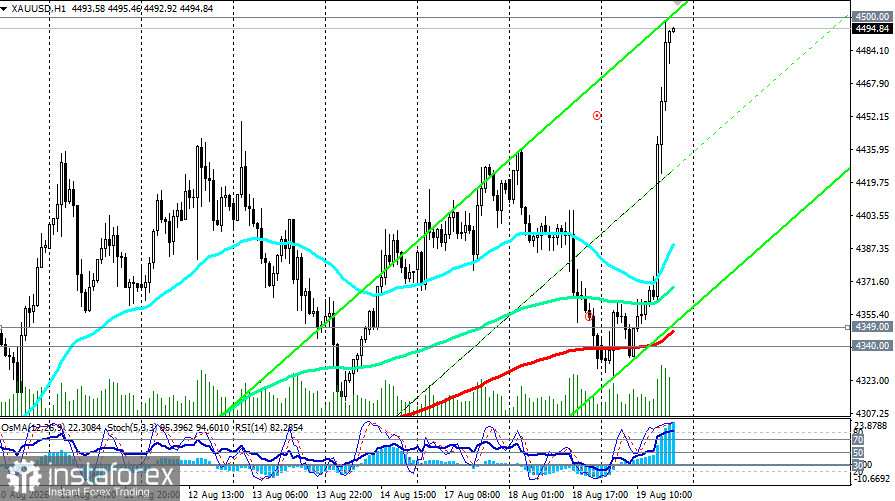
On Tuesday, gold was a market underperformer, and on Wednesday the price was close to the 4500.00 mark.
The key event that changed market dynamics was the announcement by the U.S. Treasury. The department will at least double the maximum volume of buyback operations for long-term government bonds—from $2 billion to $4 billion per operation in the 10–20-year and 20–30-year segments.
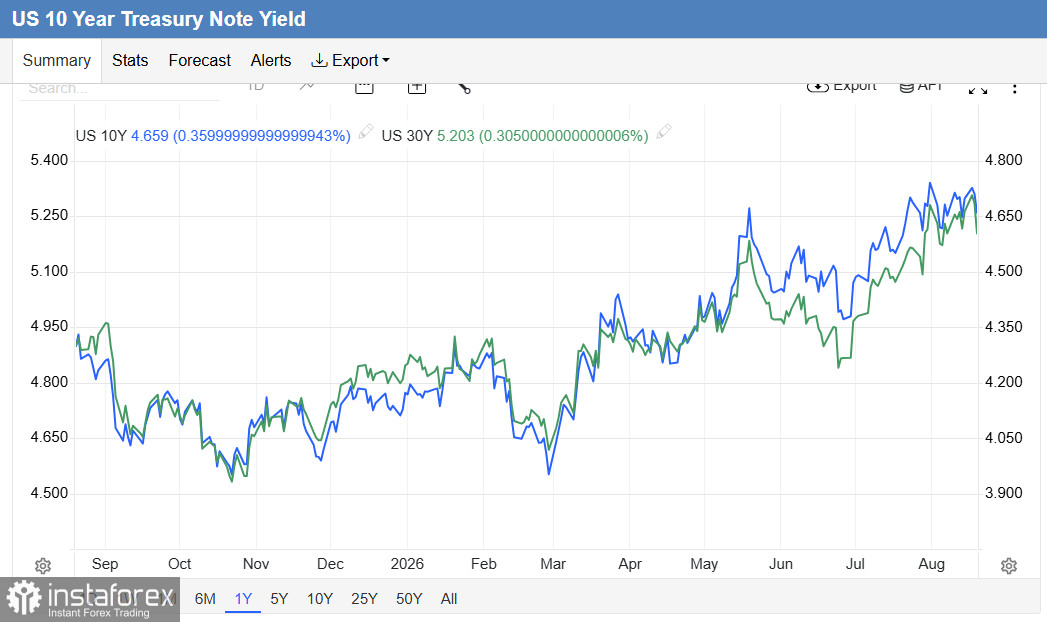
The markets interpreted this decision as a signal of Washington's readiness to intervene to curb rising yields at the so-called long end of the curve. The result was swift: the yield on 30-year Treasuries, which had just reached its highest levels since 2007 (above 5.30%), fell nearly 9 basis points. The yield on 10-year bonds also dropped by more than 5 basis points, retreating from the 4.75% mark.
This led to an immediate weakening of the U.S. dollar: the USDX index fell to its lowest level since May 29, around 98.80. The dollar faced double pressure—lower yields reduced the currency's interest-rate support, and weak U.S. economic data had already undermined expectations for a Federal Reserve rate hike.
Brief Technical Analysis
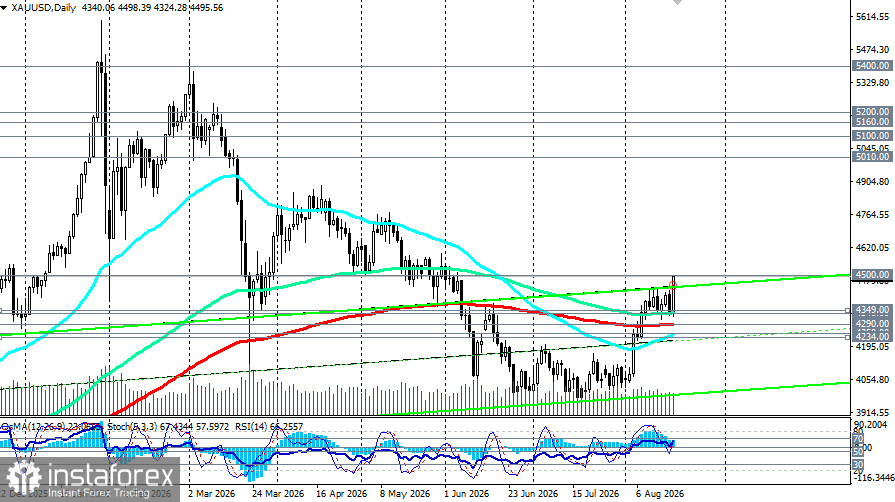
On the daily chart, gold has made a decisive breakout from several days of consolidation and returned to a bullish market zone. After fluctuating for several weeks within the range of 4300.00–4450.00, the breakout above the upper boundary confirmed a change in the short-term trend.
Indicators and Moving Averages on the Daily Chart:
- The 200-day EMA is around 4290.00, acting as key support.
- The RSI (14) has risen above 66, approaching the overbought zone, indicating strong bullish momentum but also a potential short-term correction.
- OsMA: The histogram has stopped declining and remains in positive territory, confirming strengthening bullish momentum.
- The Stochastic is in the buying zone.
Key Levels:
- Resistance: 4500.00 (psychological level), 4550.00 (next barrier).
- Support: 4450.00–4460.00 (previous resistance turned support), 4400.00 (psychological level), 4349.00 (200 EMA on H1), 4340.00 (144 EMA on D1), 4300.00 (round level), 4290.00 (200 EMA on D1).
Key Events to Watch
| Date | Event | Expected Impact on XAU/USD |
|---|---|---|
August 19 | FOMC Meeting Minutes | "Dovish" tone = support; "Hawkish" = pressure |
August 19 | U.S. 20-Year Bond Auction | High demand = lower yields = support |
August 27-29 | Jackson Hole Symposium | Key event for Fed rate expectations |
Conclusion
Gold has made a technical breakthrough that may signify the beginning of a new upward movement. The decision by the U.S. Treasury has acted as the catalyst that the market was waiting for: it weakened the dollar, lowered yields, and opened the path to 4500.00. However, as economists note, the Treasury intervention is more of a temporary measure, not a fundamental solution. Key factors for further growth will remain Fed signals this week and developments in the geopolitical situation.
For Short-Term Traders:
- Enter long positions on a strong close above 4500.00, targeting 4550.00–4600.00 and a stop-loss below 4450.00.
- Consider short positions only on a breakout below 4450.00 with confirmation from fundamental factors and a stop-loss above 4510.00.
- Pay attention to the FOMC minutes and the results of the 20-year bond auction—unexpected signals can provoke sharp movements.
For Medium-Term Investors:
- Take a constructive position considering the weakening dollar, declining expectations for Fed rates, and structural support from central banks.
- Potential corrections to 4400.00–4450.00 can be used to build long positions.
Risk Management:
- Maintain caution ahead of the FOMC minutes publication—volatility may be high.
- Strictly adhere to stop-losses—a breakout of key levels can trigger significant moves.
- Monitor bond yield dynamics, which remain a key factor for short-term pressure on gold.