 English
 Русский
 Bahasa Indonesia
 Bahasa Malay
 ไทย
ไทย Español
 Deutsch
 Български
 Français
 Tiếng Việt
 中文
中文 বাংলা
বাংলা हिन्दी
 Čeština
 Українська
 Română


Following yesterday's significant corrections, Bitcoin and Ethereum are not backing down. Today, BTC has returned to around $77,500, and Ethereum has recovered above $2,400.

The August rally has caused the market to revisit the well-known structure of Bitcoin's four-year cycle, linked to the halving. The pattern is as follows: approximately 500 days of growth following a reduction in supply are followed by a protracted correction lasting around 365 days, after which the cycle repeats. Counting from the last halving on April 20, 2024, the phase of active growth, by this logic, was supposed to end in early September 2025, which indeed aligns roughly with Bitcoin's historical high in October of the same year. Following that was a prolonged decline that lasted most of 2026, and if the pattern holds, its conclusion and the start of a new growth phase should occur in October of this year. If we push this forward by a month, as was done with the peak, November could be the pivotal month for the new bull cycle spanning a year and a half.
The historical logic behind these calculations is based on the behavior of the three previous cycles, in which the bottom of the bear market consistently formed within 778-924 days after the corresponding halving. At the same time, the phase of active growth before that took a comparable length of time. It is important to understand the limitations of such arithmetic; each previous cycle consisted of events that were different in nature, from the Mt. Gox collapse to the Chinese ban on mining and subsequent recovery. Simply mechanical averaging of intervals on the current cycle does not take into account the institutional changes of recent years, including the emergence of spot ETFs, corporate Bitcoin treasuries, and a much more mature derivatives infrastructure.
If October does indeed become the turning point from an ending correction to a new growth phase, as the historical model suggests, the coming weeks should show steady consolidation above key resistance levels, rather than another pullback like the one after Warsh's hawkish speech at Jackson Hole.
If that's the case, the time for Bitcoin at the $60,000 mark is over, and now is the most attractive pricing for long-term purchases.
Regarding short-term trading, the strategy and conditions are outlined below.
Bitcoin
Buy Scenario
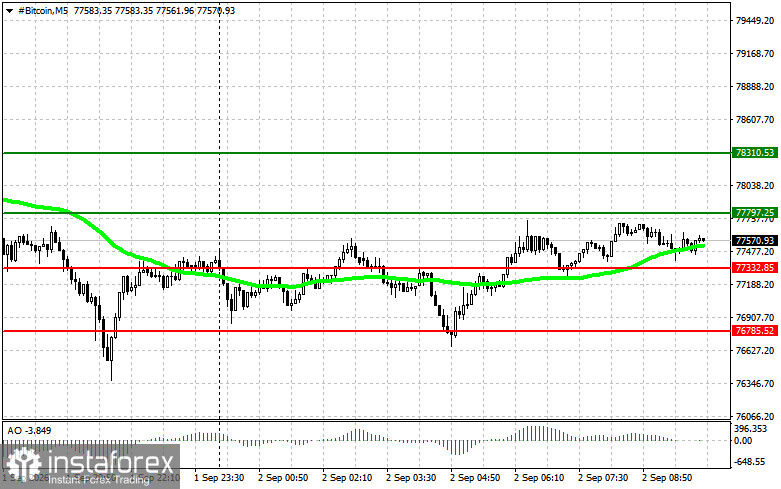
Scenario #1: I will buy Bitcoin today upon reaching an entry point around $77,800, targeting growth to the level of $78,300. At approximately $78,300, I plan to exit my buy positions and sell immediately on the bounce. Before buying on the breakout, ensure that the 50-day moving average is below the current price and that the Awesome indicator is above zero.
Scenario #2: Bitcoin can also be bought from the lower boundary of $77,300 if there is no market reaction to its breakout back towards the levels of $77,800 and $78,300.
Sell Scenario
Scenario #1: I will sell Bitcoin today upon reaching an entry point around $77,300, targeting a decline to the level of $76,700. At around $76,700, I plan to exit my sell positions and buy immediately on the bounce. Before selling on the breakout, ensure that the 50-day moving average is above the current price and that the Awesome indicator is below zero.
Scenario #2: Bitcoin can be sold from the upper boundary of $77,800 if there is no market reaction to its breakout back towards the levels of $77,300 and $76,800.
Ethereum
Buy Scenario
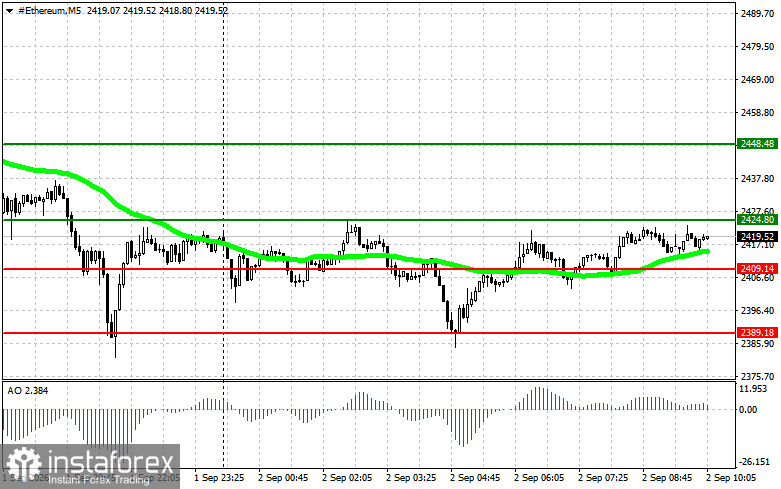
Scenario #1: I will buy Ethereum today upon reaching an entry point around $2,424, targeting growth to the level of $2,448. At approximately $2,448, I plan to exit my buy positions and sell immediately on the bounce. Before buying on the breakout, ensure that the 50-day moving average is below the current price and that the Awesome indicator is above zero.
Scenario #2: Ethereum can also be bought from the lower boundary of $2,409 if there is no market reaction to its breakout back towards the levels of $2,424 and $2,424.
Sell Scenario
Scenario #1: I will sell Ethereum today upon reaching an entry point around $2,409, targeting a decline to the level of $2,389. At approximately $2,389, I plan to exit my sell positions and buy immediately on the bounce. Before selling on the breakout, ensure that the 50-day moving average is above the current price and that the Awesome indicator is below zero.
Scenario #2: Ethereum can be sold from the upper boundary of $2,424 if there is no market reaction to its breakout back towards the levels of $2,409 and $2,389.