 English
 Русский
 Bahasa Indonesia
 Bahasa Malay
 ไทย
ไทย Español
 Deutsch
 Български
 Français
 Tiếng Việt
 中文
中文 বাংলা
বাংলা हिन्दी
 Čeština
 Українська
 Română


Bitcoin rose by $18,000 in just a few days, but the rapid surge quickly halted. Of course, this may be a simple pause — a calm before another rally. Bitcoin often pauses during strong trends and then can resume powerful moves even without a significant correction. Thus, the inability of Bitcoin to continue upward right now does not mean the local "bullish impulse" is over. Remember that neither Ethereum nor Bitcoin has yet broken the downward trends that began last year, so the current upward impulse should be regarded as local. There is also a high probability of a range forming on the daily and weekly timeframes. On the weekly timeframe the current upswing looks like a simple correction and the downtrend is not finished.
Meanwhile, the upcoming Nonfarm Payrolls report looms on the horizon. No matter how much the market now believes in Federal Reserve tightening, the current state of the U.S. labor market cannot be ignored. Recall that traders currently have no explicit signals from the Fed about a planned rate hike. On the contrary, Fed policymakers are not commenting on future rate moves, and Kevin Warsh only speaks about high inflation without the central bank taking coordinated action. But what does all this mean for Bitcoin?
In fact, if the Fed does not tighten policy in 2026, that would be very good for risk assets. And the Nonfarm Payrolls report would significantly reduce the probability of tightening. Remember, the U.S. labor market has been weakening for four months in a row, and the last annual report showed a negative figure that the market interpreted as positive only because it expected an even worse revision. Thus, the weaker tomorrow's Nonfarm Payrolls prove to be, the better for Bitcoin and other crypto assets. It is not guaranteed that the crypto market will react immediately to this report or to the unemployment rate, but in the medium term abandoning tightening would be supportive.
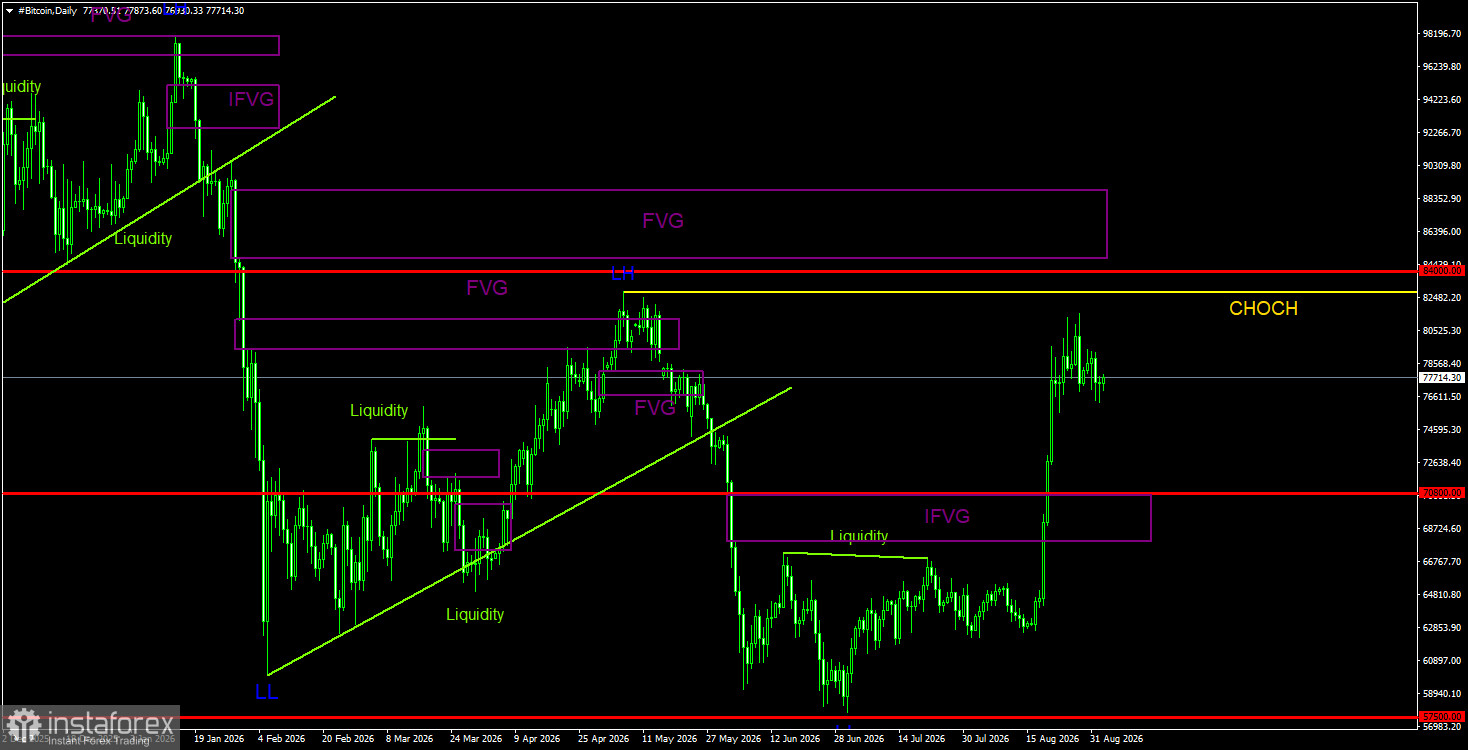
General picture of BTC/USD on 1D
On the daily timeframe Bitcoin continues to form a downtrend. The trend is identified as bearish, and the CHOCH line is at $82,800, where the last Lower High (LH) formed. Only above that level can the downtrend be considered complete. The last and only "bearish" FVG has been pierced and turned into a "bullish" IFVG. Thus, in the future this area will be a POI for long positions. Bitcoin has not yet broken the downtrend, but over the past two weeks the chances of ending the bearish trend have risen sharply. However, there is a high probability of a range forming between $60,000 and $82,500. That would mean price could take liquidity from the last LH and begin a new decline.
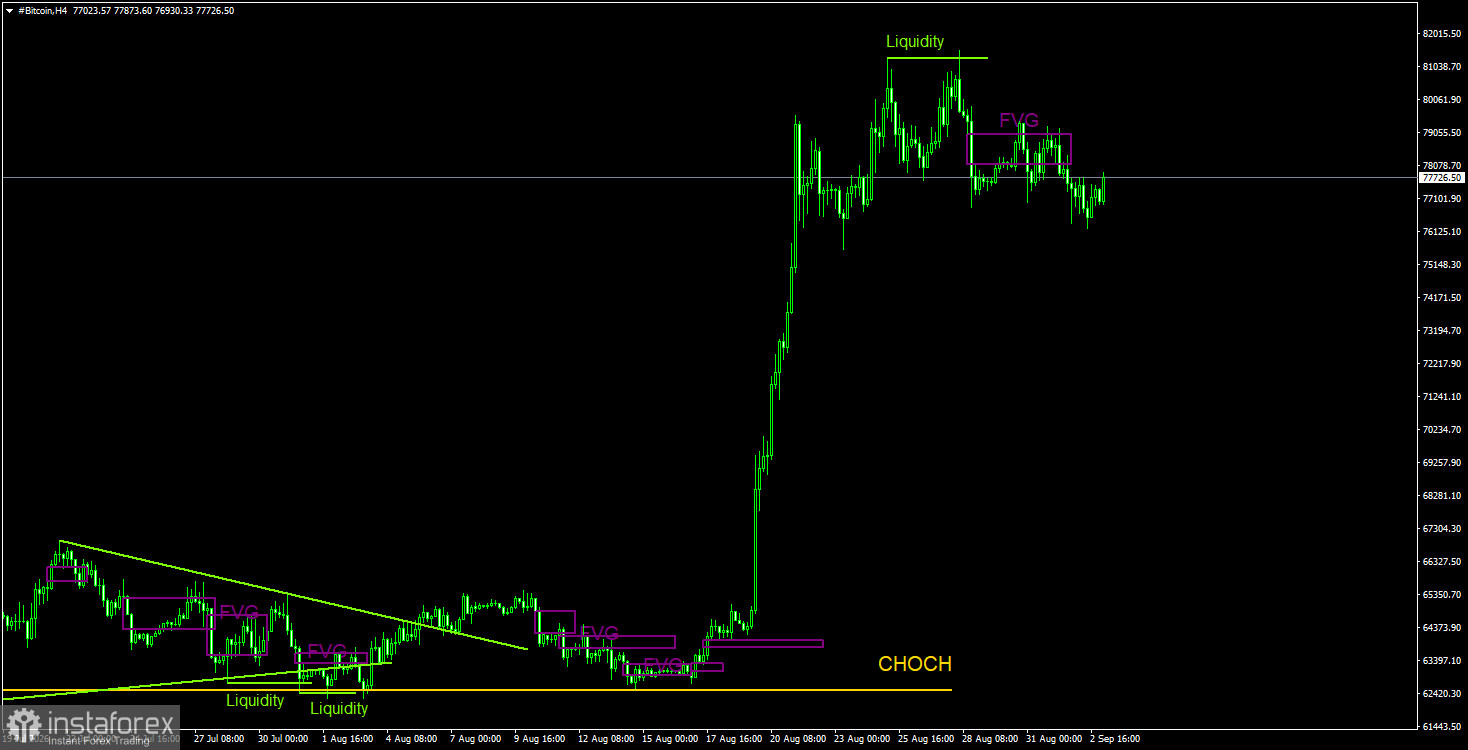
General picture of BTC/USD on 4H
On the 4-hour timeframe it is obvious how Bitcoin literally shot upwards. Analyzing the 4-hour timeframe right now is of limited use because the moves are too strong. Therefore, signals in the coming days should be sought on the daily or even weekly timeframe. Nevertheless, one point is important: liquidity was taken from the last peak, which warned traders of a possible decline. The decline has already started, but it cannot be guaranteed that it will be large or prolonged. The only pattern worth noting on the 4-hour chart is the bearish FVG. If a downward impulse begins, the price may resume falling from that pattern.
Trading recommendations for BTC/USD
Bitcoin continues to form a downtrend despite the strong rise last week. We continue to expect a decline toward $57,500 (the 61.8% Fibonacci retracement of the three-year uptrend), although that level has effectively already been tested. We do not believe the downtrend has ended. The current rally of the leading cryptocurrency resembles a pump rather than a bona fide corrective structure, and this is not a sufficient reason to open long positions. The current move most resembles a pump: liquidity may be taken from the $82,850 high, which could trigger a decline and confirm a transition to sideways action. On the 4-hour chart one can expect a new leg down from the last bearish FVG.
Explanations for illustrations
CHOCH — change of character / break of the trend structure.
Liquidity — liquidity such as stop losses and pending orders that market makers use to build positions.
FVG — Fair Value Gap / area of price inefficiency: price moves quickly through such areas indicating absence of one side; price often returns to react to such areas in the direction of the main trend.
IFVG — Inverted FVG. After returning to such an area, price may not react and instead impulsively break through and then test from the other side.
OB — Order block. A candle where a market maker opened positions to collect liquidity and then establish a position in the opposite direction.