 English
 Русский
 Bahasa Indonesia
 Bahasa Malay
 ไทย
ไทย Español
 Deutsch
 Български
 Français
 Tiếng Việt
 中文
中文 বাংলা
বাংলা हिन्दी
 Čeština
 Українська
 Română


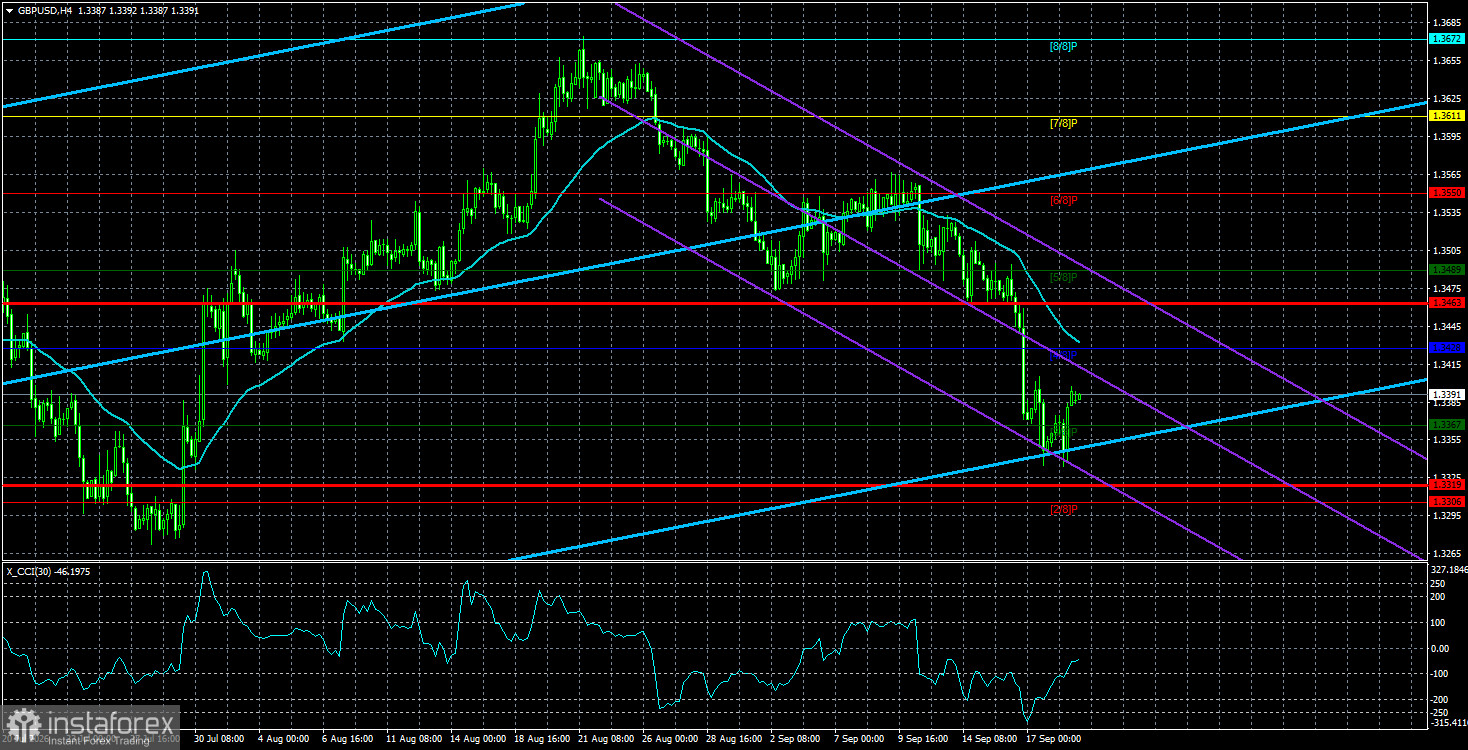
The GBP/USD pair on Friday again tried to start an upward correction after nearly a month of decline. In fact, not only a correction but a potential new uptrend is ripening, since the US dollar once again managed to gain significantly on a fundamental backdrop that did not obviously justify such a strong and sustained rally. But markets don't follow logic — they follow flows — so we have what we have.
This week macro data and fundamental events are unlikely to be the primary focus for traders. All three central-bank meetings have already taken place, and the market has received comprehensive information about policymakers' likely near-term actions; the macro releases that will materially influence central-bank policy will arrive later. This week the most notable items are PMI business-activity indices for September in the UK, the euro area and Germany, and the US durable-goods orders report. Because volatility has fallen to very low levels in recent months, we should not expect large trending moves; an upward correction is more likely.
Of course, a new "black swan" can arrive at any moment. For example, speculation has been growing that Donald Trump may resume strikes on Iran. Tehran has sent Washington a new set of conditions for ending the conflict — conditions Trump is unlikely to accept. While many experts expect Trump to soften his stance on Iran ahead of the midterms, we believe his position will remain uncompromising. That would mean a second season of these confrontations could begin after the congressional elections — and what that season would look like may be unknown even to Trump.
Meanwhile, energy prices are either rising or remain unacceptably high for many countries. Autumn is approaching, and then winter, when demand for oil and gas increases while strategic inventories gradually deplete. We therefore see no reason for oil, fuel or gas prices to fall in the near term. Prices are likely to keep rising or at least stay elevated, fueling global inflation or keeping it persistently high. The Federal Reserve last week showed its willingness to tighten policy to bring inflation down to 2%, but with current global developments, the Fed may need to hike more than two or three times to stop inflation from accelerating. The question remains how far the Fed, the Bank of England and the European Central Bank are willing to go in a hawkish direction — whether they will raise rates until inflation is firmly back on a downward path.
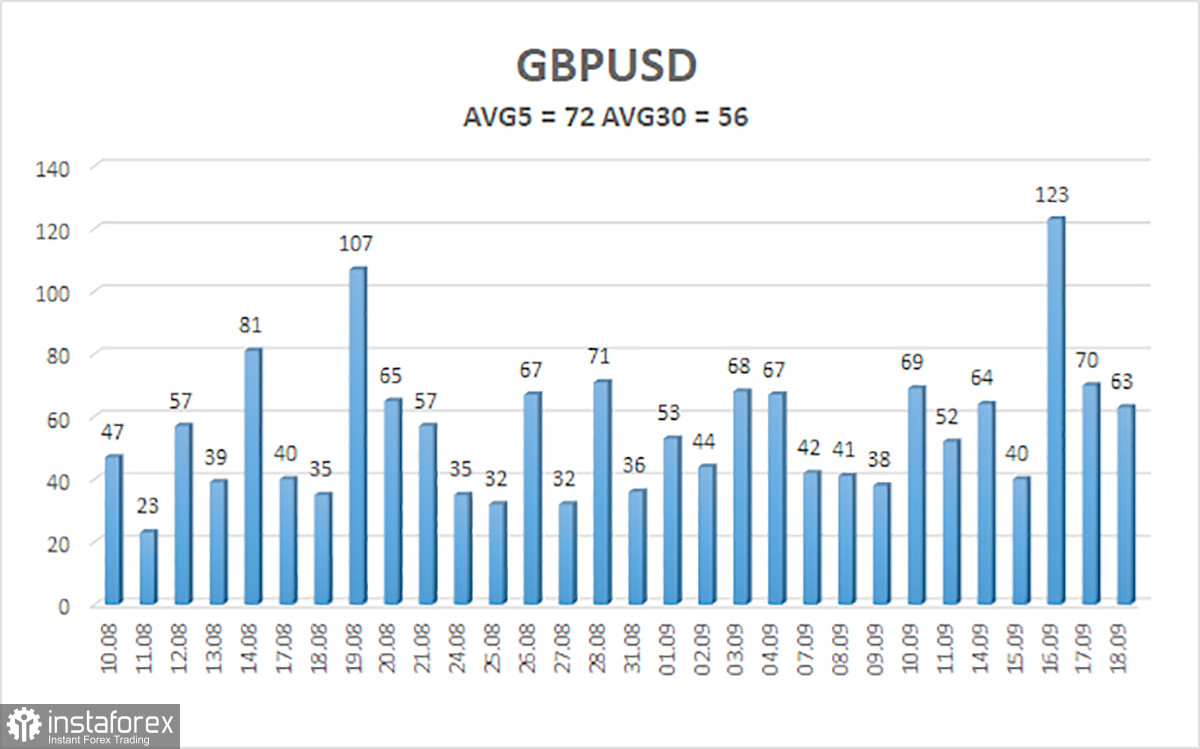
The average volatility of the GBP/USD pair over the last 5 trading days is 72 pips. For the pound/dollar, this value is classified as "medium." Therefore, on Monday, September 21, we expect movement inside a range bounded by 1.3319 and 1.3463. The higher linear-regression channel has turned up, indicating an uptrend. The CCI entered the oversold area, warning of a possible end to the downward trend.
Nearest support levels:
S1 – 1.3367
S2 – 1.3306
S3 – 1.3245
Nearest resistance levels:
R1 – 1.3428
R2 – 1.3489
R3 – 1.3550
Trading recommendations:
The GBP/USD pair maintains an uptrend. Donald Trump's policies will continue to weigh on the US economy, so we do not expect long-term dollar strength. So far, 2026 has been positive for the dollar due to geopolitics and inflation, which have driven capital to safe havens and prompted the Fed to return to tightening. However, on the weekly timeframe, price remains flat between 1.3150 and 1.3780 within a four-year uptrend, supporting expectations for continued pound appreciation in the medium term. Long positions with targets 1.3550 and 1.3611 can be considered while price is above the moving average. Price below the moving average would justify bearish trading, with targets of 1.3319 and 1.3306.
Explanations for Illustrations:
Regression channels help determine the current trend. If both are directed in the same direction, it means the trend is currently strong;
The moving average line (settings 20,0, smoothed) defines the short-term trend and the direction in which trading should be conducted at present;
Murray levels are target levels for moves and corrections;
Volatility levels (red lines) are the probable price channel within which the pair will spend the next 24 hours based on current volatility indicators;
The CCI indicator – its entry into the oversold area (below -250) or the overbought area (above +250) indicates that a trend reversal in the opposite direction is approaching.