 English
 Русский
 Bahasa Indonesia
 Bahasa Malay
 ไทย
ไทย Español
 Deutsch
 Български
 Français
 Tiếng Việt
 中文
中文 বাংলা
বাংলা हिन्दी
 Čeština
 Українська
 Română


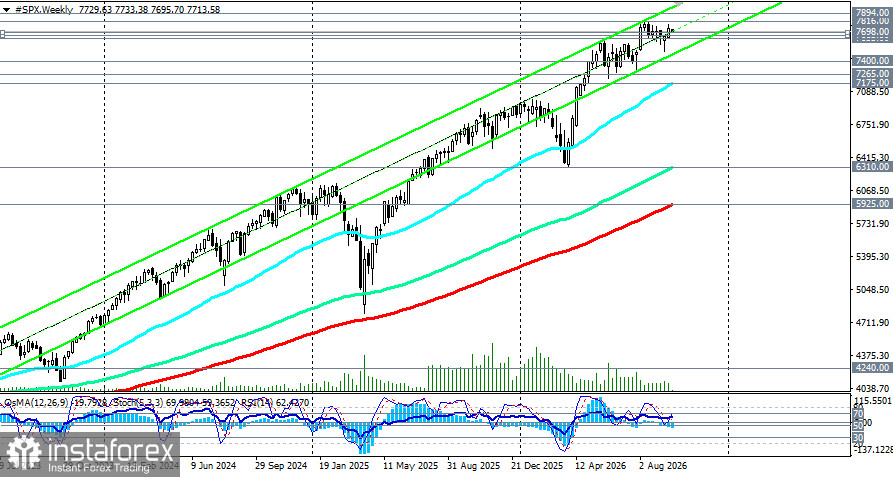
The S&P 500 is holding near record highs, supported by a tech-led rally and strong corporate profits. However, the upside is limited by bond yields at multi-year peaks and the risk of an October rate hike.
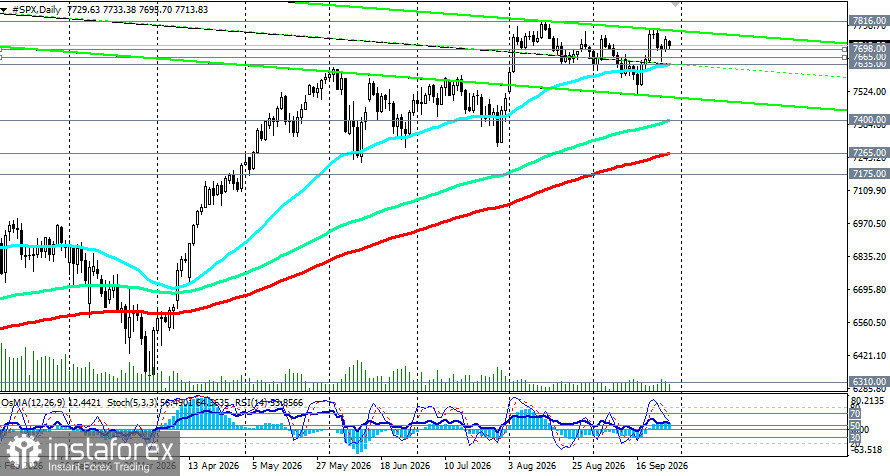
Technically, the daily picture remains moderately bullish, but short-term indicators point to overheating and possible consolidation. On the 1-hour chart, the price is easing toward the key support level of 7,698 (200-EMA), from which a bounce is possible if the broader bullish backdrop holds.
Buy entries can be considered on a sustained breakout of local resistance at 7,760, with targets at 7,800–7,850 and a stop-loss order below 7,665 (200-EMA on the 4-hour chart).
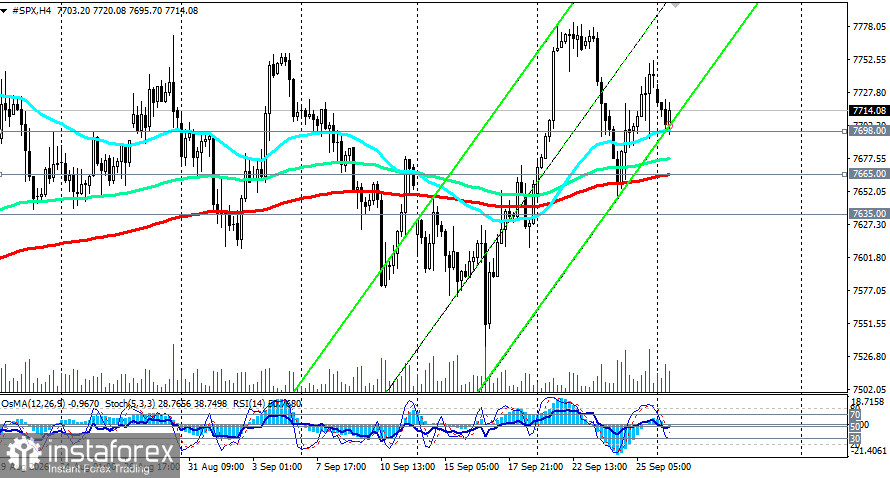
Conditions for the bullish scenario:
- Sustained breakout of 7,760, consolidation above it, and confirmation from indicators (RSI > 60, OsMA maintaining bullish momentum).
- Weak PCE (September 30) or weak NFP (October 2) data, reducing the odds of an October Fed hike.
- Treasury yields falling below 5.00% and a weaker dollar.
- Technical confirmation: RSI(14) above 65 and accelerating OsMA.
Short positions can be considered on a break of 7,698 and then 7,665, with targets at 7,635 (50?EMA on the daily)–7,585 and a stop-loss order above 7,760.
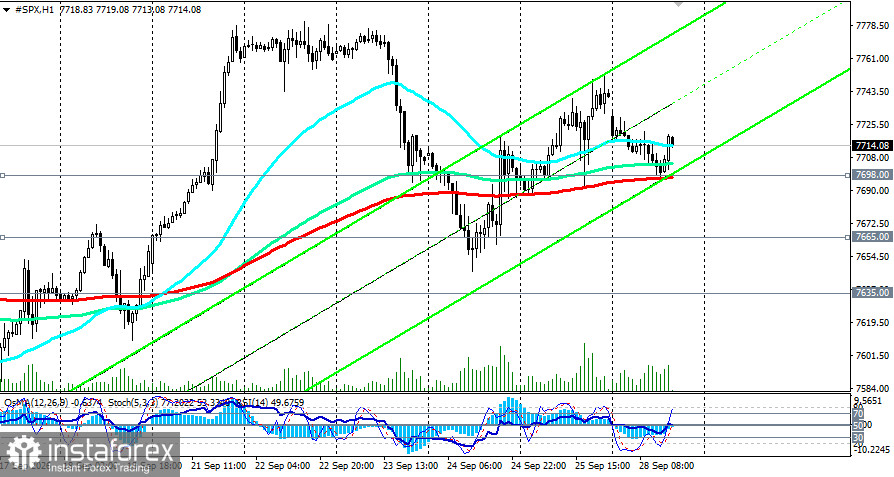
A deeper correction targets the important medium-term support near 7,400 (round level and 144-EMA on the daily).
Conditions for the bearish scenario:
- Break and hold below 7,635, opening the path to 7,585–7,400.
- Strong PCE or NFP data confirming persistent inflation and a tight labor market.
- Continued rise in yields above 5.25%.
- Technical confirmation: RSI(14) below 45 and accelerating decline in OsMA.
Summary (base case): consolidation in 7,635–7,800 with a bullish tilt ahead of PCE and NFP. A break above the range opens 7,820–7,900; a break below points to 7,585–7,550.
Logic:
- The S&P 500 sits at the intersection of two powerful forces. On one side, strong corporate earnings — consensus expects roughly 23% Y/Y profit growth in Q3 — and an AI investment boom provide fundamental support. On the other side, Treasury yields at multi-year highs and nearly 70% odds of an October hike create a strong headwind.
- Breadth is a concern: the median S&P 500 stock is up only ~5.6% YTD, and just 59% of constituents are in positive territory. That means the index's gains are narrow and concentrated in a handful of tech giants, which raises the risk of a sharp correction if sentiment shifts.
- This week's macroeconomic calendar featuring inflation and labor market prints is the key near-term driver. Strong PCE/NFP data would push yields higher and test 7,585–7,550; disappointing prints would favor a breakout above 7,800 toward 7,900.
Trading scenarios
Bullish (resistance breakout):
- Buy Stop 7,760.00. Stop-Loss 7,660.00. Targets: 7,800.00, 7,820.00, 7,850.00, 7,900.00.
Bearish (support breakout):
- Sell Stop 7,660.00. Stop-Loss 7,760.00. Targets: 7,635.00, 7,600.00, 7,585.00, 7,550.00, 7,500.00, 7,400.00.
Notes: "Targets" correspond to support/resistance levels used as planning reference points — not guarantees of execution. Use them to size positions, set stop-loss orders, and manage risk.