 English
 Русский
 Bahasa Indonesia
 Bahasa Malay
 ไทย
ไทย Español
 Deutsch
 Български
 Français
 Tiếng Việt
 中文
中文 বাংলা
বাংলা हिन्दी
 Čeština
 Українська
 Română


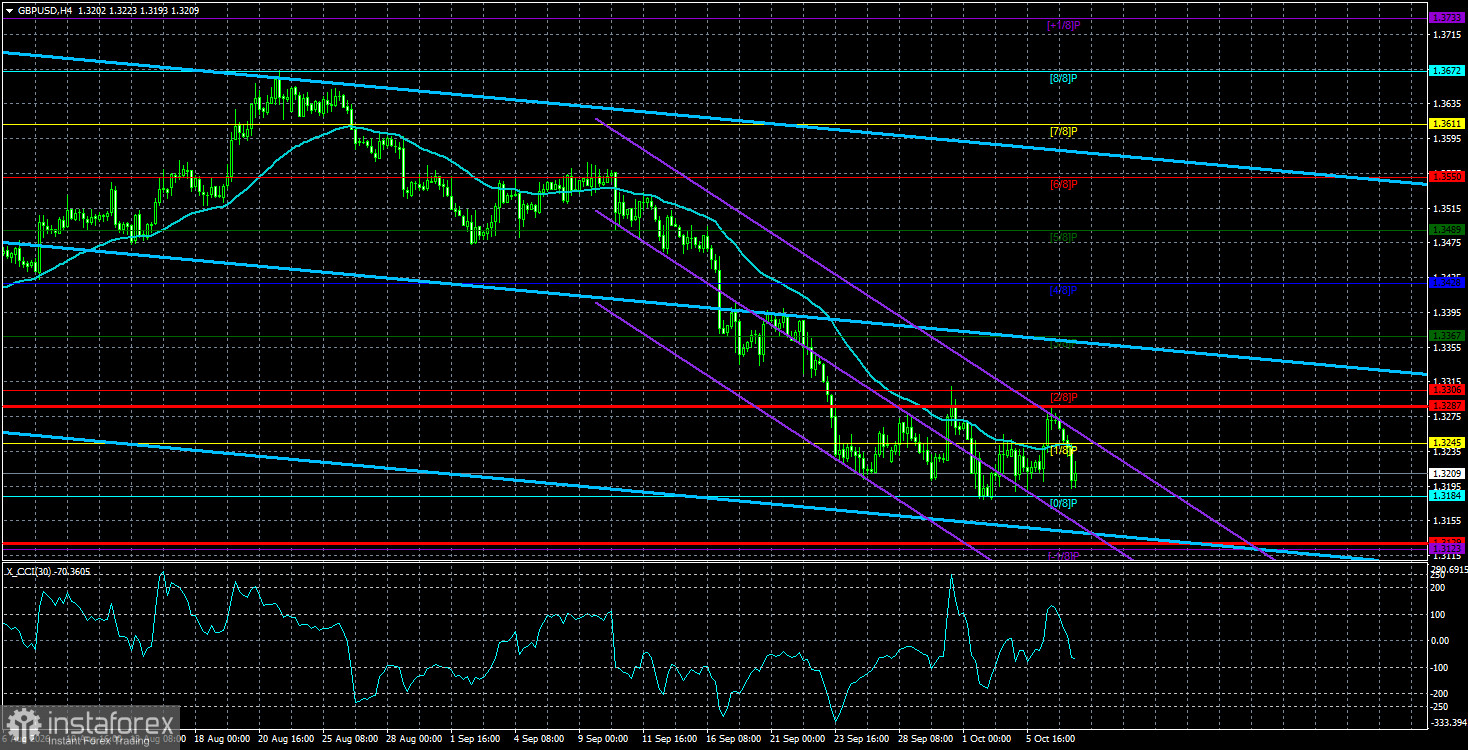
The GBP/USD currency pair also moved lower on Wednesday, but the situation for the British pound is somewhat different from that of the euro. The pound has spent the last two weeks in a sideways channel. On the daily and weekly timeframes, it is likewise in a flat. Thus, on almost any timeframe right now, you can legitimately see random movements explained by a flat. Also note that price sits near the lower boundary of all three sideways channels. It does not matter much whether those boundaries are pierced or overcome in the near term. In technical analysis, concepts include a rejection (bounce) or a breakout of a level/area/boundary. But other analytical approaches interpret the same moments differently.
We are talking about liquidity grabs and deviations. A liquidity grab is a sharp, often manipulative drop through some level or technical reference that sits above pending orders and Stop Losses. A liquidity grab may look like a breakout, yet it is not one in the structural sense. In that case, market-makers aim only to obtain the liquidity needed to open positions in the opposite direction. To buy a currency, someone must sell it. Traders even have a phrase for this — "eating the stops." "Eating stops" is far from rare and is not merely figurative. When price is near the lower boundary of a sideways channel (especially a yearly one), it is unsurprising that Stop Losses and limit orders for buys or sells sit below and above that boundary. To capture liquidity at those orders, price can move manipulatively toward them and then reverse sharply.
Therefore, in our view, the pound is not necessarily close to a new drop or the continuation of the old one. It is close to either a bounce off the lower boundary of all three channels or to a liquidity sweep of those boundaries and recent lows. If so, given the baselessness of the current pound weakness, we would not rule out a strong rally beginning soon.
Is further decline of GBP/USD possible? Yes — because anything can happen in the market. We once didn't believe oil could hit $0, but April 2020 showed that is possible too. However, we cannot explain any convincing reasons why the dollar should continue rising. Thus, such a downside scenario is a backup — we expect something different. By the way, why did the pound fall on Wednesday if the euro's fall is blamed on the French budget crisis? What does France have to do with the pound? In our view, it is obvious that the causes of the current decline long ago ceased to be geopolitical, macroeconomic, or fundamental.
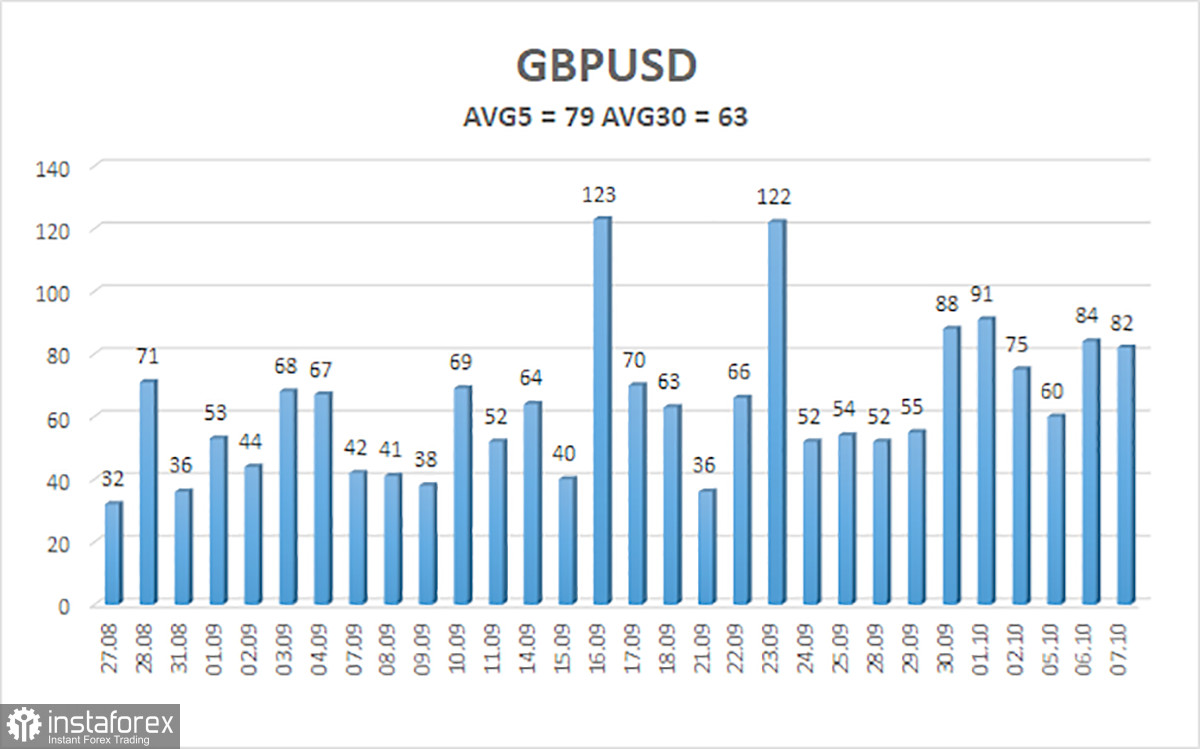
The average volatility of the GBP/USD pair over the last 5 trading days as of October 8 is 79 pips and is characterized as "average." We expect the pair to move within the range of 1.3129 to 1.3287 on Thursday, October 8. The higher linear-regression channel has turned down again. The CCI indicator has entered the oversold area twice already, warning of a possible end to the downward trend.
Nearest support levels:
S1 – 1.3184
S2 – 1.3123
S3 – 1.3062
Nearest resistance levels:
R1 – 1.3245
R2 – 1.3306
R3 – 1.3367
Trade recommendations:
The GBP/USD currency pair continues its illogical downward movement. Donald Trump's policies will continue to put pressure on the US economy, so we do not expect the US dollar to strengthen in the long term. So far, 2026 has been positive for the dollar due to geopolitics and inflation, which forced capital into safety and prompted the Federal Reserve to return to monetary tightening. However, on the weekly timeframe, a flat range persists between 1.3150 and 1.3780 within a four-year uptrend, which supports the case for medium-term pound appreciation. Consider long positions with targets of 1.3367 and 1.3428 when price is above the moving average. Price below the moving average allows bearish trading, with targets of 1.3184 and 1.3129. Be cautious with short positions, as price is currently near the lower boundary of the long-term sideways channel.
Explanations for the illustrations:
- Linear regression channels help determine the current trend. If both are directed the same way, the trend is currently strong.
- The moving average line (settings 20,0, smoothed) defines the short-term tendency and the direction in which trading should be conducted now.
- Murray levels are target levels for moves and corrections.
- Volatility levels (red lines) show the likely price channel the pair will trade in over the next 24 hours, based on current volatility indicators.
- The CCI indicator — entering the oversold area (below -250) or the overbought area (above +250) — signals an imminent trend reversal in the opposite direction.