 English
 Русский
 Bahasa Indonesia
 Bahasa Malay
 ไทย
ไทย Español
 Deutsch
 Български
 Français
 Tiếng Việt
 中文
中文 বাংলা
বাংলা हिन्दी
 Čeština
 Українська
 Română


Iran continues to use the Strait of Hormuz as a key tool to pressure the world. Interestingly, it seems that only Donald Trump is at war with and making demands of Iran, while the rest of the world must bear the consequences of that war. Of course, countries with their own oil and gas stand to benefit. However, it would be wrong to say anyone supports a Middle East war solely because oil and energy prices spike.
In recent weeks, Brent crude has stabilized around $105 a barrel. That level cannot be called "low," but in current conditions it is also not "high." The peak price — $120 — was reached at the peak of the fighting in the Middle East. Yet, everyone now understands that $120 is far from the maximum possible price for black gold. Therefore, the reference point should not be $120 a barrel as the ceiling. One should instead consider any hypothetical level that might be reached if the Bab el-Mandeb Strait were to be blocked.
Remember that world demand for energy falls in spring, summer, and autumn because of warm weather. However, in winter the need to heat homes, factories, offices, and even vehicles rises sharply. Accordingly, demand for fuel increases. Current global energy supplies are insufficient even to cover present needs. What can be said about winter, when demand will grow?
Iran, for which a Hormuz blockade is the main trump card against Trump, understands that the world will eventually find alternative routes around the strait, discover new oil fields, build new processing and production plants, partially switch to green energy, or even revert to coal. In any case the "Hormuz Trump" will not be relevant forever.
Therefore, Tehran cannot allow oil prices to fall. If prices drop and supply rises, Iran could build a dam in the middle of Hormuz, and no one would care. That is why it is important to use this card here and now.
Accordingly, in recent weeks Tehran has intensified attacks on commercial tankers trying to pass through Hormuz. We do not know the logic used to select the ships to be struck, but clearly some pattern exists. And it probably goes like this—we need high oil prices, so it does not matter which ships are attacked. The main thing is that the Strait of Hormuz remains dangerous for any vessel.
Other articles by the author:
EUR/USD review. October 8. Music did not play for long.
GBP/USD review. October 8. GBP keeps holding.
Trading recommendations and analysis for EUR/USD on October 8
Trading recommendations and analysis for GBP/USD on October 8
Trading recommendations for EUR/USD:
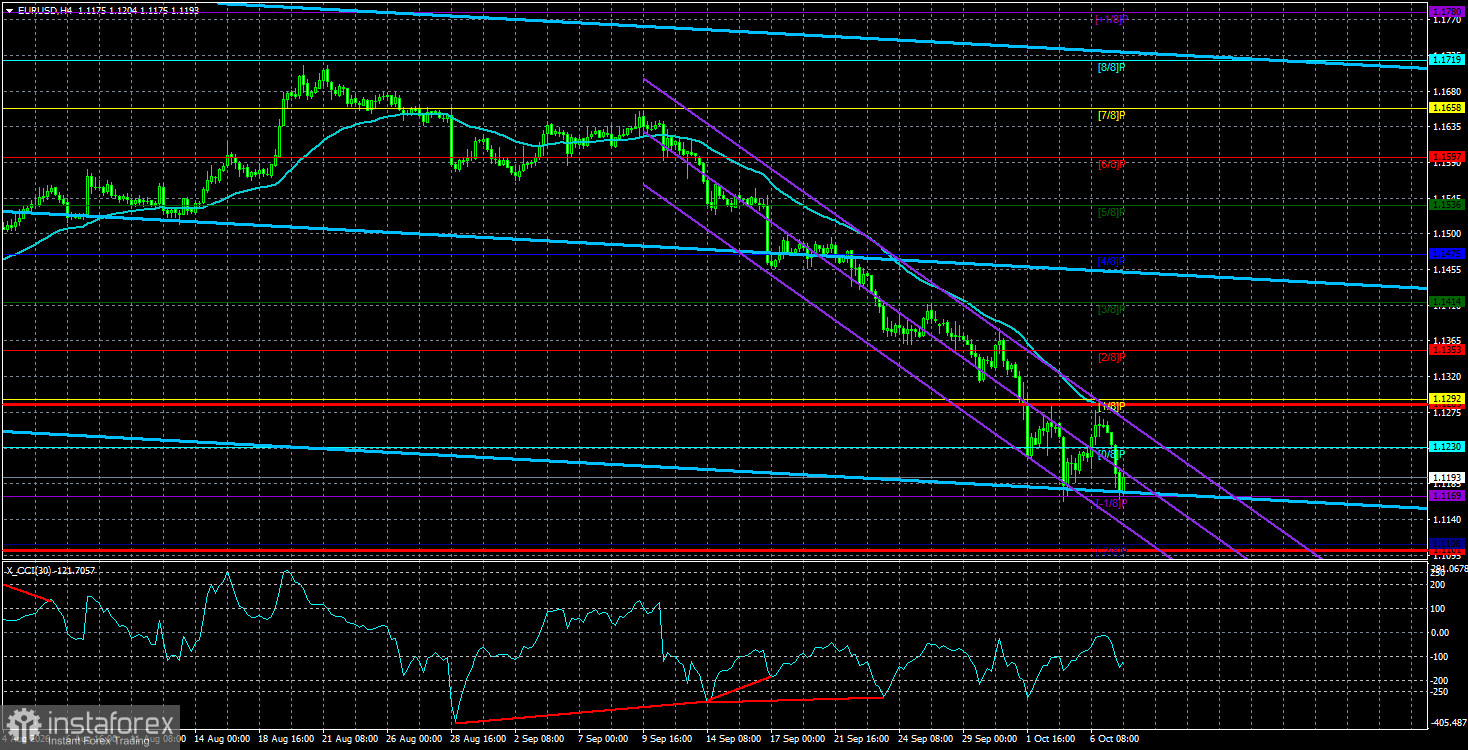
EUR/USD continues to move lower, but we still view the pair's decline as a correction ahead of a new uptrend. The global fundamental backdrop for the dollar remains negative, but in 2026 geopolitics first and then the Fed's hawkish stance provided powerful support for the US currency. When the price is below the moving average, shorts can be considered with targets of 1.1108 and 1.1101. Above the moving average, long positions are relevant with targets at 1.1353 and 1.1414.
Trading recommendations for GBP/USD:
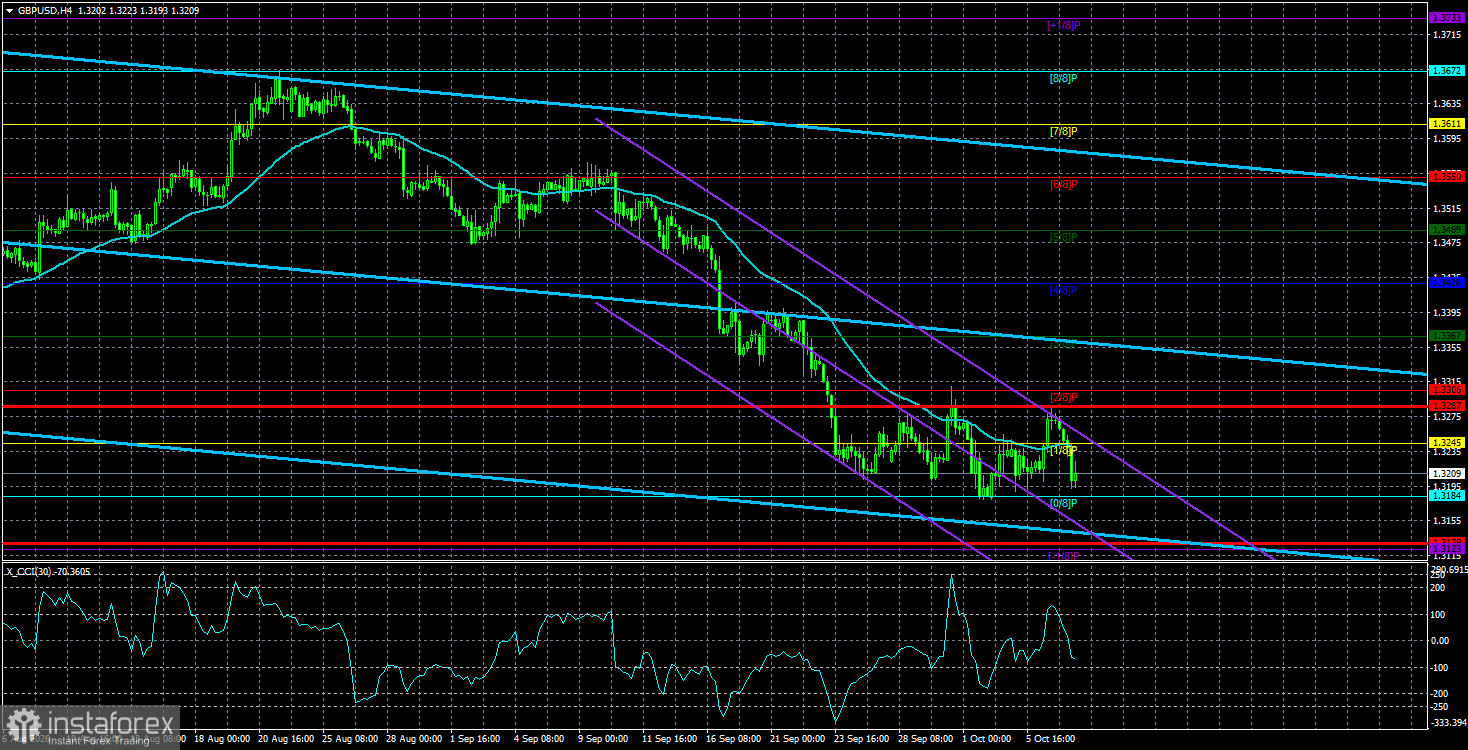
GBP/USD continues an illogical downward move. Donald Trump's policies will continue to pressure the US economy, so we do not expect long-term weakness of the US currency. So far, 2026 has been positive for the dollar because geopolitics and inflation have forced capital to seek safety and the Fed to return to tightening. However, on the weekly timeframe the pair remains flat between 1.3150 and 1.3780 within a four-year uptrend, which supports a medium-term outlook for sterling. Long positions with targets of 1.3367 and 1.3428 can be considered if the price is above the moving average. Prices below the moving average allow trading the downside with targets at 1.3184 and 1.3129. Be cautious with shorts, as the price sits at the lower boundary of the long-term sideways channel!
Explanations for the illustrations:
Regression channels help identify the current trend.
If both channels point the same way, the trend is strong.
The moving average (settings 20,0, smoothed) defines the short-term tendency and the direction traders should follow.
Murray levels are target levels for moves and corrections.
Volatility levels (red lines) mark the likely price channel for the next 24 hours based on current volatility.
The CCI indicator entering oversold (below -250) or overbought (above +250) territory signals an approaching trend reversal.