 English

 Русский
 Bahasa Indonesia
 Bahasa Malay
 ไทย
 Español
 Deutsch
 Български
 Français
 Tiếng Việt
 中文
 বাংলা
 हिन्दी
 Čeština
 Українська
 Română



GBP/USD
Brief Analysis:
The current downward wave structure on the chart of the British pound's major pair dates back to late January of this year. Over the past few months, a complex correction in the form of a horizontal extended flat has been developing within this wave structure. The correction has entered its final phase, but no signals confirming its completion have appeared at the time of analysis.
Weekly Forecast:
During the coming week, the pair is expected to move within a range between the nearest opposing zones. A slight downward bias is more likely at the beginning of the week. The projected support zone may come under pressure, potentially resulting in a brief break below its lower boundary. The probability of a reversal and a renewed downward move will increase toward the end of the week.
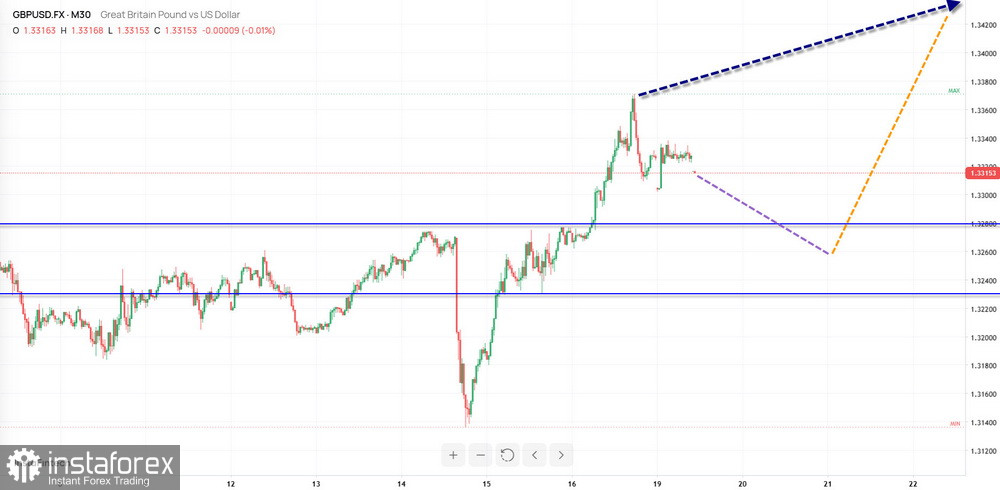
Potential Reversal Zones
Resistance:
- 1.3460/1.3510
Support:
- 1.3280/1.3230
Recommendations
Buying: Long positions may become possible with reduced position sizes for intraday trading once reversal signals appear near the support zone.
Selling: Short positions may be considered during individual trading sessions with reduced position sizes.
AUD/USD
Brief Analysis:
Since the beginning of the year, the Australian dollar major pair has continued to trade predominantly sideways. The current unfinished downward segment dates back to September 9. During the final ten days, a flat correction developed within this segment, which remained incomplete at the time of analysis. The price is currently near the lower boundary of an intermediate resistance zone.
Weekly Forecast:
Over the next couple of days, the pair is expected to trade sideways, creating conditions for a potential change in direction. Pressure on the upper boundary of the resistance zone is possible. A reversal may occur closer to the end of the week. A move below the projected support zone is unlikely during the coming week.
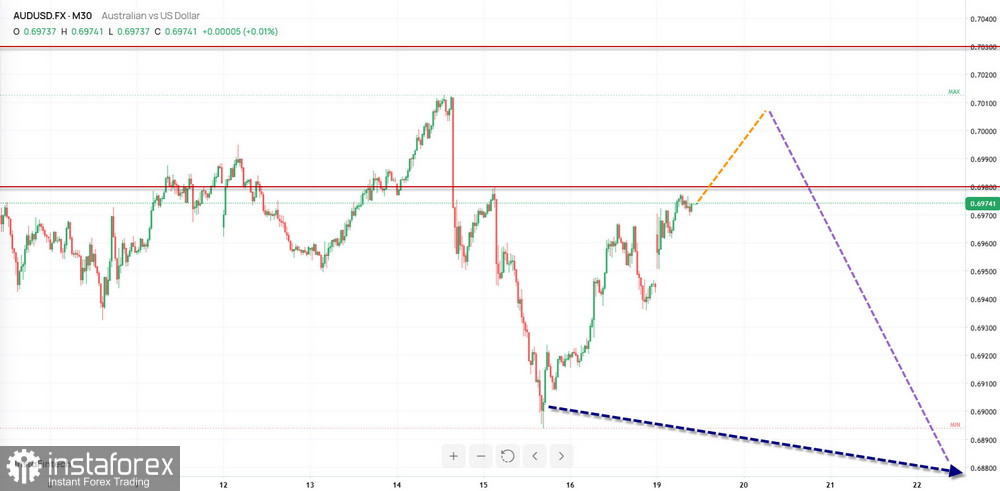
Potential Reversal Zones
Resistance:
- 0.6980/0.7030
Support:
- 0.6830/0.6780
Recommendations
Selling: Short positions may become appropriate once confirmed reversal signals appear near the support zone.
Buying: Long positions have limited potential and carry a high level of risk.
USD/CHF
Brief Analysis:
The current wave structure on the USD/CHF chart is directed upward. It began on April 11 and has developed predominantly sideways. On the higher daily time frame, this segment represents a reversal of the preceding trend. Within the final part of wave (C), the price is forming a retracement.
Weekly Forecast:
At the beginning of the coming week, sideways movement is highly likely. A decline toward the support zone cannot be ruled out. The probability of a reversal and a resumption of upward movement will increase closer to the weekend. The resistance zone lies along the lower boundary of the potential reversal zone on the 4-hour time frame.
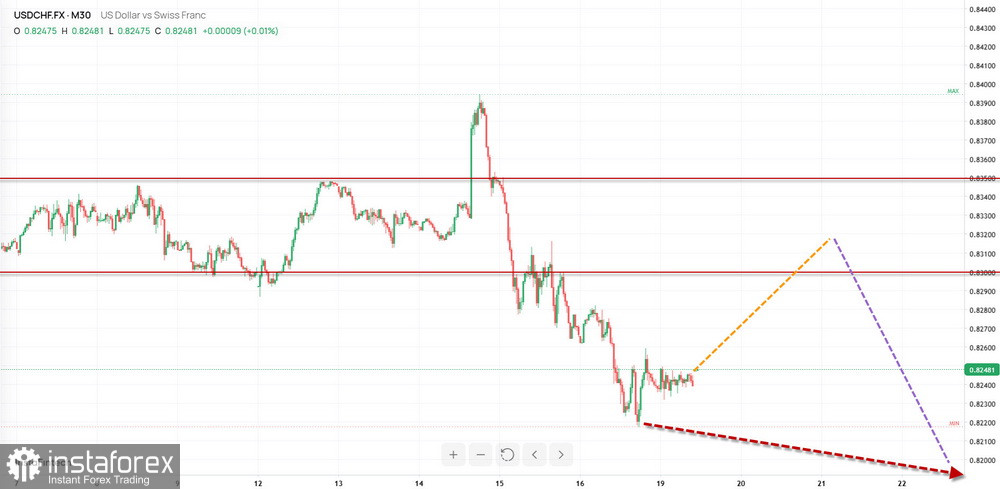
Potential Reversal Zones
Resistance:
- 0.8300/0.8350
Support:
- 0.8130/0.8080
Recommendations
Selling: Short positions may be considered for short-term trading with reduced position sizes.
Buying: Long positions may become possible once reversal signals appear near the support zone on the trading systems you use.
EUR/JPY
Brief Analysis:
Since late April of this year, the price direction of the EUR/JPY pair has been determined by a downward wave structure. Within its final part, wave (C), an intermediate correction has been developing over the past two weeks. Throughout this period, the price has moved sideways within a potential reversal zone on the higher time frame.
Weekly Forecast:
At the beginning of the coming week, the pair is expected to rise and move sideways along the boundaries of the projected resistance zone. A subsequent reversal and resumption of the downward move can then be anticipated. The support zone indicates the most likely lower boundary of the pair's weekly trading range.
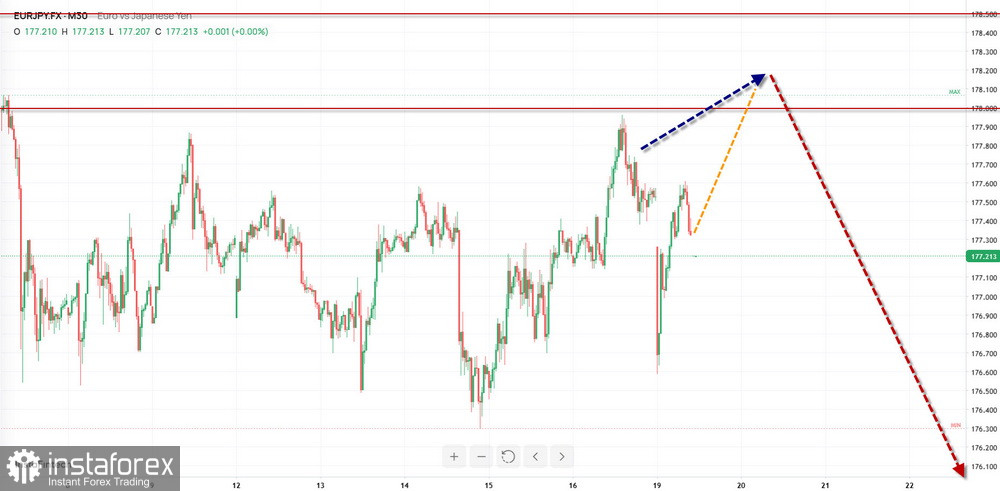
Potential Reversal Zones
Resistance:
- 178.00/178.50
Support:
- 175.00/174.50
Recommendations
Buying: Long positions have no significant potential.
Selling: Short positions may become appropriate once corresponding confirmed reversal signals appear near the resistance zone.
Ethereum
Brief Analysis:
Following a multi-month upward correction, Ethereum's price has reached the boundaries of a broad potential reversal zone on the higher time frame. Since late September, Ethereum has begun declining from intermediate resistance. The overall wave structure does not appear to be complete. The potential downside movement has not yet exceeded the retracement level.
Weekly Forecast:
Throughout the coming week, Ethereum is expected to trade within a range between opposing zones. Sideways movement is likely at the beginning of the week, although an upward move cannot be ruled out. A reversal and resumption of the decline may occur closer to the weekend. A breakout beyond the projected zones is unlikely during the week.
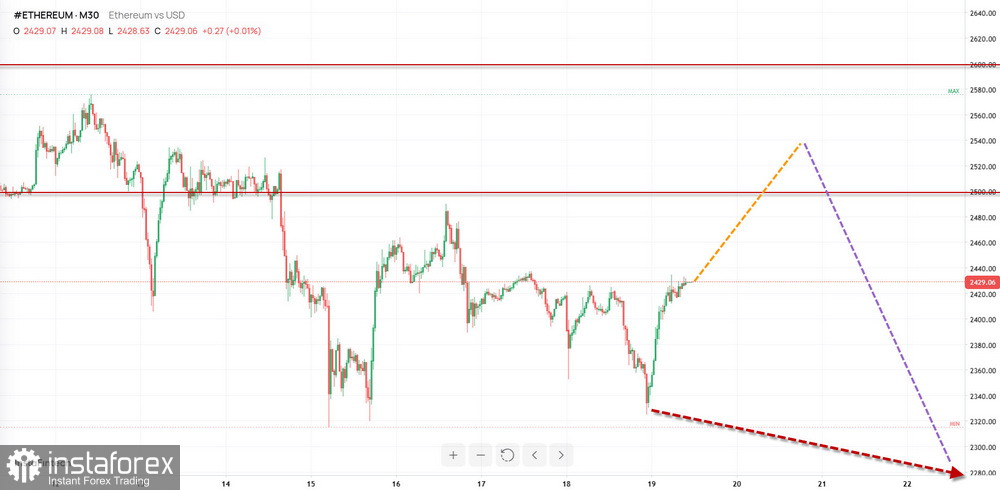
Potential Reversal Zones
Resistance:
- 2500.0/2600.0
Support:
- 1950.0/1850.0
Recommendations
Selling: Short positions may become appropriate once corresponding confirmed reversal signals appear near the resistance zone.
Buying: Long positions are risky and have limited potential.
Explanatory Notes: In simplified wave analysis (SWA), all waves consist of three parts (A-B-C). The latest unfinished wave is analyzed on each time frame. Dashed lines indicate expected price movements.
Important: The wave algorithm does not take into account the duration of price movements over time.