 English

 Русский
 Bahasa Indonesia
 Bahasa Malay
 ไทย
 Español
 Deutsch
 Български
 Français
 Tiếng Việt
 中文
 বাংলা
 हिन्दी
 Čeština
 Українська
 Română



Friday's Trade Review:
GBP/USD 1H Chart
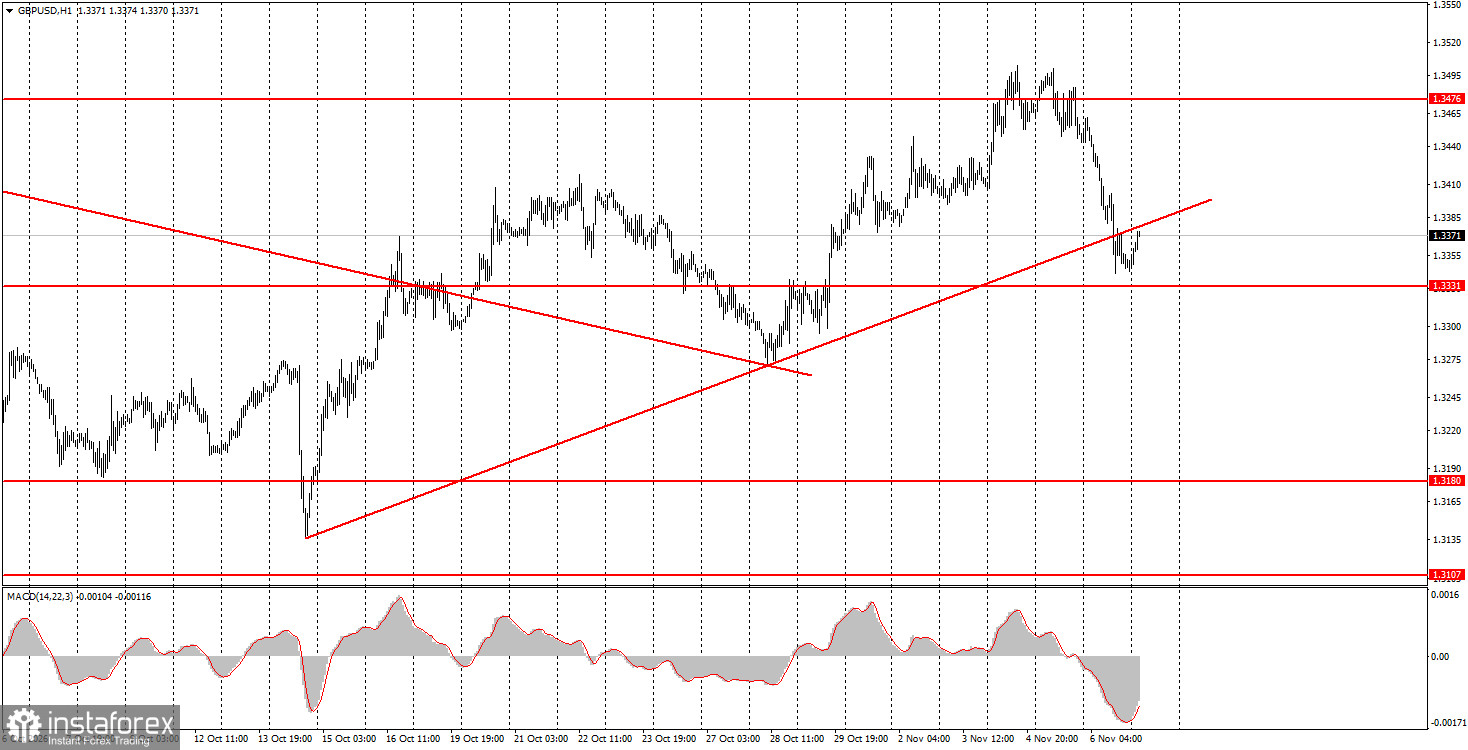
The GBP/USD pair also declined throughout Friday. However, the decline in the British pound on the final trading day of the week carries greater significance than the corresponding decline in the euro. As a result of this decline, GBP/USD fell below the upward trendline, indicating that the uptrend has ended from a technical perspective. If this assessment is correct, the British pound's decline is likely to continue. However, how far could it extend?
On Friday, the US dollar received support from stronger-than-expected Nonfarm Payrolls and unemployment data, which somewhat eased the Federal Reserve's position. Nevertheless, these reports did not fundamentally change the Fed's outlook or the prospects for its monetary policy. The regulator was already planning another key interest rate hike in December, while the market was already pricing in this decision with a probability close to 100%.
Thus, a new downward trend has technically begun, while fundamental factors still provide no clear grounds for significant US dollar appreciation. On the daily and weekly timeframes, the price remains within sideways channels, with lower boundaries in the 1.3120–1.3150 level. The expected scenario is a move toward the upper boundaries at 1.3650 and 1.3780.
GBP/USD 5M Chart
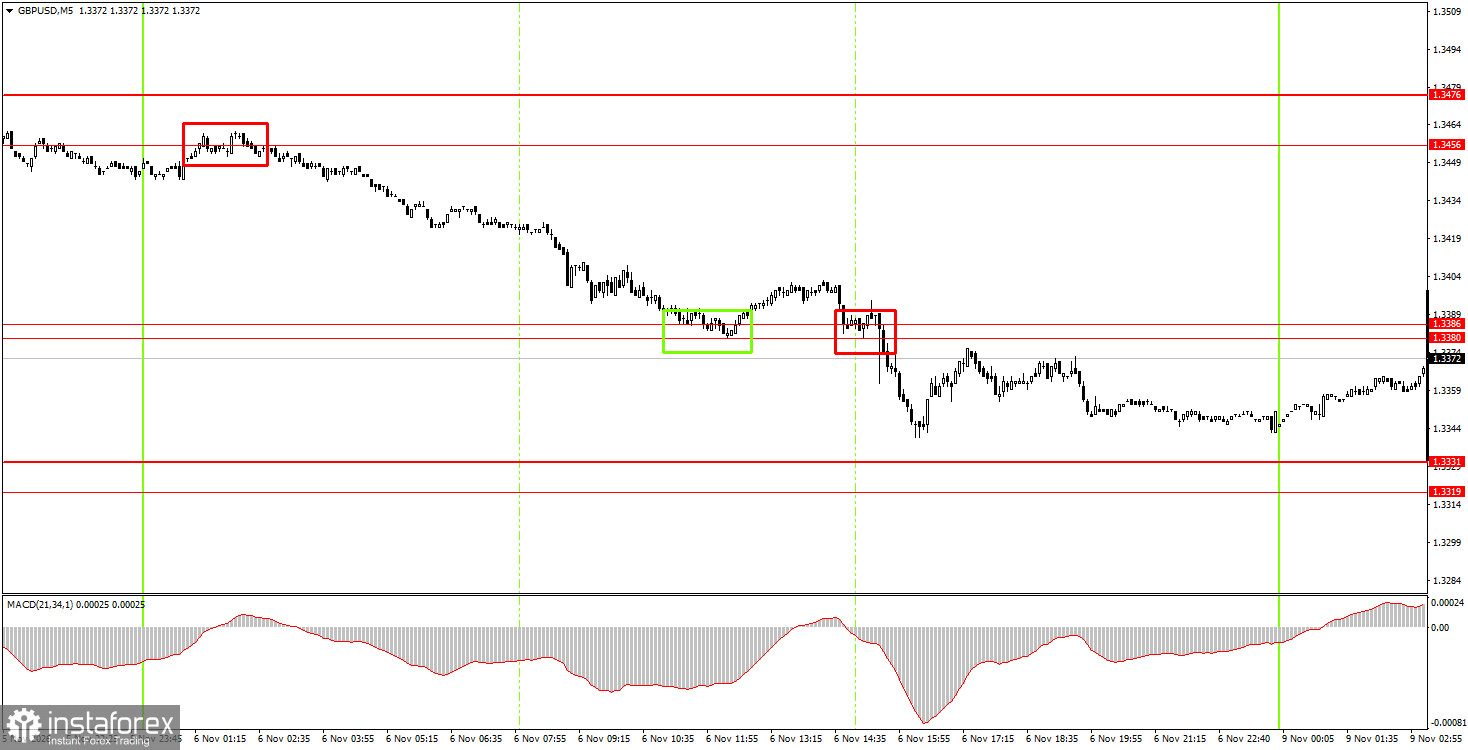
Three trading signals were generated on the 5-minute timeframe on Friday. During the overnight session, the price rebounded from the 1.3456–1.3476 level, providing an opportunity to open short positions. During the European trading session, the price rebounded from the 1.3380–1.3386 level, but this buy signal proved false. The subsequent sell signal allowed the pair to decline by another 20 pips. Thus, two out of the three signals were profitable.
How to Trade on Monday:
In the hourly timeframe, GBP/USD has completed the formation of an upward trend. The British pound is generally trading much more consistently than the euro and therefore has good prospects for resuming its uptrend once the correction is complete. The technical picture on almost all timeframes supports further appreciation of the British currency. The sideways channels on the daily and weekly timeframes do not indicate the likelihood of a significant decline in the pair.
On Monday, beginner traders may consider opening short positions with a target of 1.3319–1.3331 if the price rebounds from the 1.3380–1.3386 level. Long positions may be opened with a target of 1.3456–1.3476 if the price consolidates above the 1.3380–1.3386 level.
On the 5-minute timeframe, the following levels can be used for trading: 1.3043, 1.3096–1.3107, 1.3175–1.3180, 1.3259–1.3267, 1.3319–1.3331, 1.3380–1.3386, 1.3456–1.3476, 1.3587–1.3598, and 1.3631–1.3641.
On Monday, Bank of England Governor Andrew Bailey is scheduled to deliver a speech in the United Kingdom. However, the outlook for the British regulator's monetary policy is currently well understood by traders. The Bank of England is expected to continue tightening monetary policy, probably at a pace similar to that of the Federal Reserve and the European Central Bank: one rate hike every two meetings.
Main Rules of the Trading System:
- Signal strength is determined by the time required for a signal to form (a rebound or a breakout of a level). The less time required, the stronger the signal.
- If two or more trades are opened near a particular level based on false signals, all subsequent signals from that level should be ignored.
- During sideways markets, any currency pair may generate numerous false signals or none at all. Technical levels may also be disregarded by price action.
- On the hourly timeframe, trading based on MACD indicator signals is advisable only when volatility is sufficiently high and a trend is present, confirmed by a trendline or trend channel.
- If two levels are located too close to each other (within 5–20 pips), they should be treated as a single support or resistance zone.
- Once the price has moved 15 pips in the correct direction, the Stop Loss should be moved to breakeven.
What the Charts Show:
Support and resistance price levels (zones) are levels that serve as targets for opening buy or sell positions or as sources of trading signals.
Red lines represent channels or trendlines that illustrate the current trend and indicate the preferred direction for trading.
MACD indicator (14, 22, 3) – the histogram and signal line serve as auxiliary indicators that can also be used to generate trading signals.
Important speeches and economic reports (listed in the economic calendar) can have a significant impact on currency pair movements. Therefore, trading should be approached with extreme caution when such events are taking place. Alternatively, positions may be closed to avoid the risk of a sharp price reversal against the prevailing movement.
Beginner Forex traders should remember that not every trade can be profitable. Developing a clear trading strategy and following sound money management principles are essential for long-term trading success.