 English

 Русский
 Bahasa Indonesia
 Bahasa Malay
 ไทย
 Español
 Deutsch
 Български
 Français
 Tiếng Việt
 中文
 বাংলা
 हिन्दी
 Čeština
 Українська
 Română



GBP/USD Analysis: 5-Minute Chart
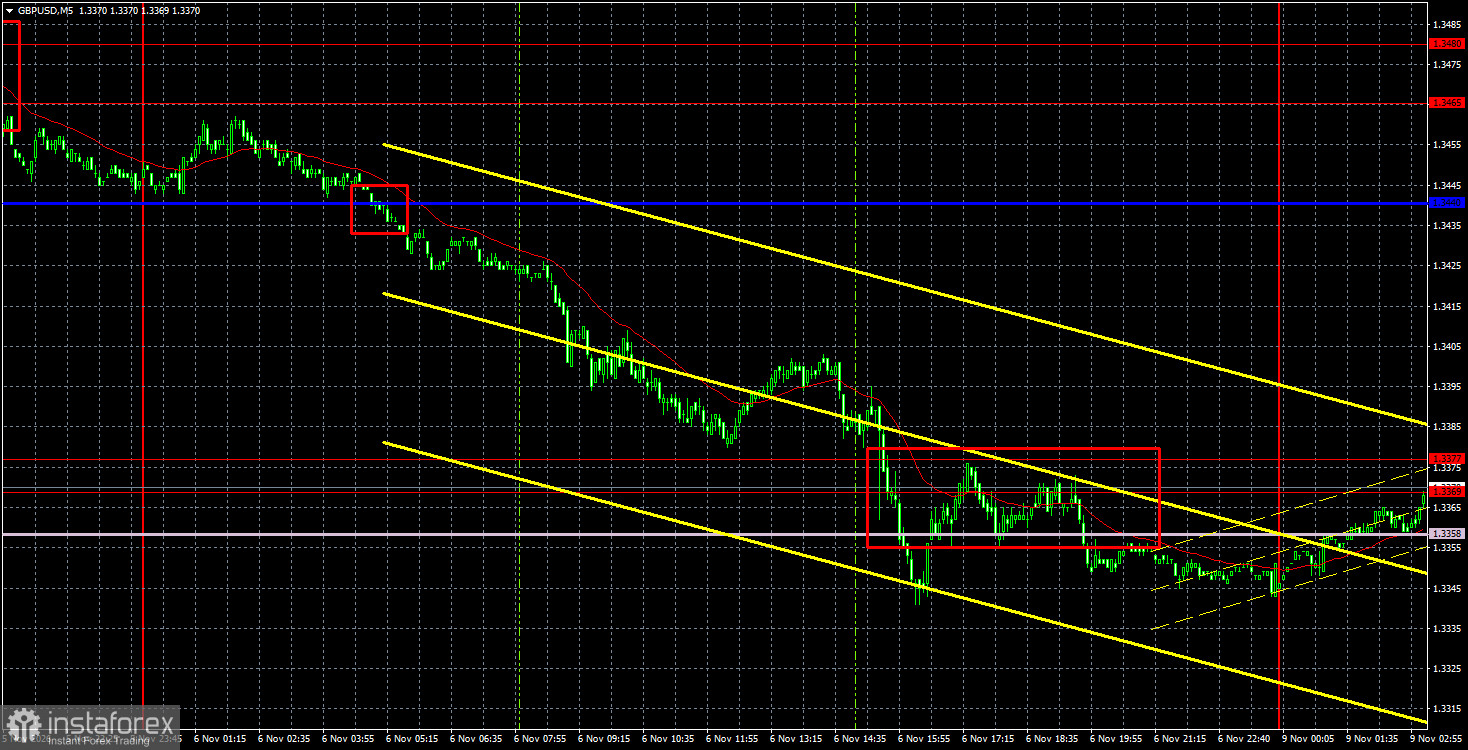
The GBP/USD currency pair continued to decline on Friday. The downward movement began at the same time as the decline in the euro, which had received clear technical sell signals. It would be inaccurate to say that the euro dragged the pound down with it, as the correlation between the two currencies has been absent recently. At the same time, the pound did not receive any independent fundamental reasons for a decline. It is worth recalling that on Thursday, the Bank of England decided to begin a monetary tightening program, and the Monetary Policy Committee's decision on the interest rate was unanimous. Therefore, the pound could easily have continued its upward movement last week. However, a correction began, which could now develop into a full-fledged downward trend. Friday's US labor market and unemployment reports merely reinforced the corrective movement observed during the final two trading days of the week.
The University of Michigan Consumer Sentiment Index was also released in the United States, showing a reading of 51.0 against forecasts of 47–48. However, this report was not enough to outweigh the impact of the Nonfarm Payrolls and unemployment data. In any case, the pound's decline began well before the release of US macroeconomic data.
From a technical perspective, the British pound has started forming a downward trend after moving below the trendline. However, it is worth noting that the price has not managed to establish itself firmly below the Senkou Span B line. Therefore, the upward trend has not yet been completely invalidated.
Two sell signals were generated on the 5-minute timeframe on Friday. The first signal, a consolidation below the critical line during the Asian trading session, could have been traded at the opening of the European session. The second signal, a consolidation below the 1.3358–1.3377 level, appeared shortly before the market closed and should therefore not have been traded.
COT Report
COT reports on the British pound show that non-commercial traders have maintained a dominant net selling position throughout 2026. The net position is negative, despite the continuation of the long-term upward trend. Given developments in the Middle East, it is hardly surprising that demand for the US dollar has remained relatively strong in 2026. The war between the United States and Iran has formally been put on hold, but it could resume at any time. The Federal Reserve's changed monetary policy stance is also supporting the dollar, while the upward trendline has been broken. However, this break occurred within a sideways market, so the upward trend is not considered complete.
Over the long term, the dollar continues to weaken due to Donald Trump's policies, as is clearly visible on the weekly timeframe. The trade war will continue in one form or another for a long time, and Trump's policies are aimed, both directly and indirectly, at weakening the US currency. The long-term upward trend remains intact. According to the latest COT report, dated November 3, the "Non-commercial" group opened 7,100 buy positions and closed 12,500 sell positions. Consequently, the net position of non-commercial traders increased by 19,600 contracts over the week.
GBP/USD Analysis: 1-Hour Chart
On the hourly timeframe, GBP/USD continues to form a technically consistent upward trend, which has not yet been completely invalidated. On the daily and weekly timeframes, the pair is moving toward the 1.3650 level, which represents the upper boundary of the sideways channel on the daily chart. Fundamental and macroeconomic reasons for the British pound to appreciate are not necessary, as GBP/USD remains within sideways channels.
For November 9, the following important levels are identified: 1.3042–1.3050, 1.3096–1.3115, 1.3179–1.3187, 1.3248, 1.3301–1.3309, 1.3369–1.3377, 1.3465–1.3480, 1.3588, and 1.3671–1.3681. The Senkou Span B (1.3358) and Kijun-sen (1.3422) lines may also generate trading signals. It is recommended to move the Stop Loss order to breakeven once the price has moved 20 pips in the expected direction. The Ichimoku indicator lines may shift during the day, which should be taken into account when identifying trading signals.
Today, Bank of England Governor Andrew Bailey is scheduled to speak in the United Kingdom. This is essentially the only notable event of the day. However, no new information is expected from Bailey, as the regulator's meeting took place just last Thursday and provided traders with a clear picture of its future policy direction.
Summary of the Analysis:
Traders may consider the 1.3301–1.3309 level as a target for short positions if the price breaks below the 1.3358–1.3377 level. Consolidation above the 1.3358–1.3377 level would make the Kijun-sen line a potential target for long positions.
Explanations for the Illustrations:
Support and resistance levels are shown as thick red lines. Price movements may end near these levels. They are not sources of trading signals.
The Kijun-sen and Senkou Span B lines are Ichimoku indicator lines transferred to the hourly timeframe from the 4-hour chart. They are considered strong technical levels.
Extreme levels are shown as thin red lines from which the price has previously rebounded. They serve as sources of trading signals.
Yellow lines represent trendlines, trend channels, and other technical patterns.
Indicator 1 on the COT charts shows the size of the net position held by each trader category.