 English

 Русский
 Bahasa Indonesia
 Bahasa Malay
 ไทย
 Español
 Deutsch
 Български
 Français
 Tiếng Việt
 中文
 বাংলা
 हिन्दी
 Čeština
 Українська
 Română



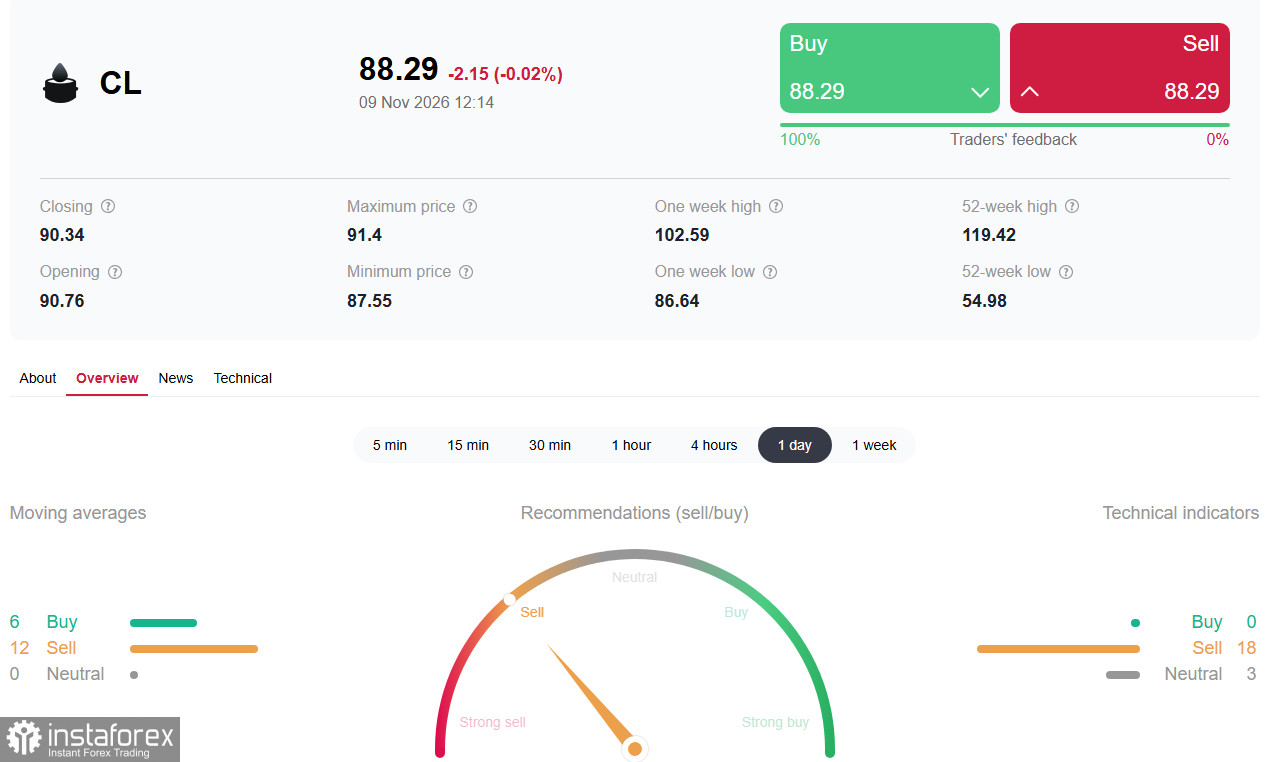
See also: Trading indicators by InstaForex for WTI (CL)
Oil started the week with declines. Brent trades around $94–96, and WTI is near $88–90 per barrel. Prices have stabilized for now, but momentum remains weak.
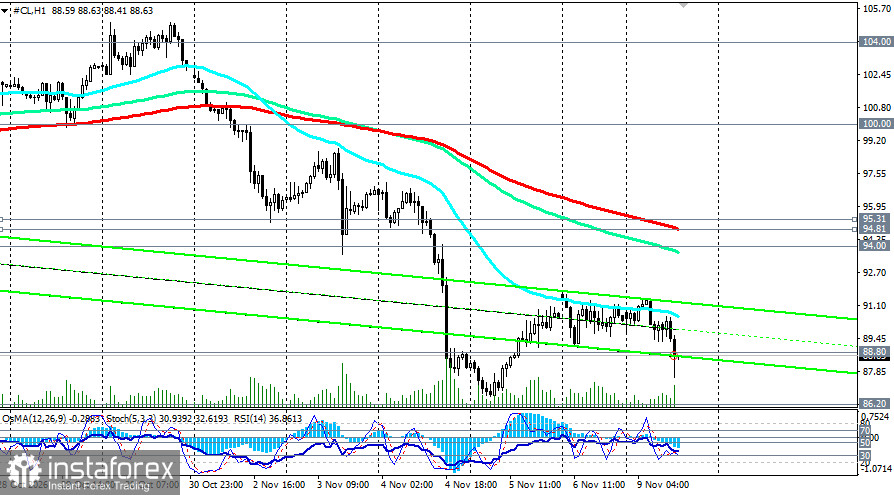
Ahead of the U.S. session on Monday, WTI futures trade around $88.30, seeking equilibrium after the worst week in months. Since late October the price plunged from above $104 to $86.65, a drop of nearly 17.5%. The cause is not rising inventories or falling demand but removal of the geopolitical risk premium: Trump said new strikes on Iran are "highly unlikely" if talks make progress, and the market treated that as a signal the acute phase of the conflict may be ending. Diplomacy, however, is far from complete and the technical picture remains fragile.
Key drivers
Diplomacy with Iran is shaving the risk premium. MUFG notes Brent fell about 16% in a week, driven mainly by renewed investor optimism about a potential U.S.–Iran deal. Trump told CNN that it is "highly unlikely" he will order new strikes if talks show progress. Secretary Rubio sounded more cautious: "I would not say we are on the verge of a breakthrough." That is the crucial nuance: the market trades hope, not fact.
Inventories remain low, but that does not rescue prices. The EIA reported commercial crude stocks fell by 865,000 barrels in the week to October 30—the fifth straight weekly decline. Distillate inventories plunged to 99.3 million barrels—the lowest since May 2003. Those data were published on November 4 and have already been priced in. The next EIA report is not due until November 12.
Saudi Arabia and the Strait of Hormuz. Despite diplomatic signals, risks remain. Saudi authorities said an administrative building at Saudi Aramco in Riyadh was hit by falling debris after an attempted strike, and the coalition intercepted two ballistic and two cruise missiles. That is a reminder the physical threat to supplies has not disappeared.
Brief technical analysis
InstaForex's aggregated daily technical analysis signal "Sell": 18 of 21 indicators favor shorts.
The short-term picture stays bearish, but oversold conditions create a risk of a technical rebound.
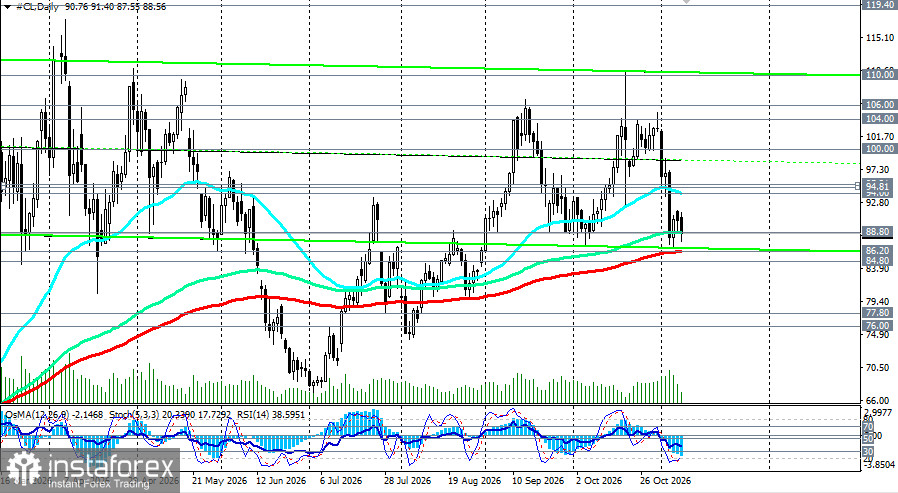
- RSI(14, daily) sits near 38—below neutral 50 but above deep oversold. This indicates sustained selling pressure without capitulation.
- OsMA remains negative; the histogram shows no sustained contraction, suggesting downside pressure persists.
- Stochastic (9,6) is in oversold territory. That supports the possibility of a technical bounce, although in a strong trend the indicator can remain low for an extended period.
EMA 50, 144, and 200 (interpretation)
- H1 EMA200 = 94.81: price is well below, short-term control with sellers.
- H4 EMA200 = 95.31: key short-term resistance. Until it is pierced, any recovery remains corrective.
- D1 EMA50 = 94.00, EMA144 = 88.80, EMA200 = 86.20: price has broken below the 50- and 144-day averages but holds above the 200-day (86.20). This is a critical fork. Holding above 86.20 preserves the long-term bullish scenario; a break lower opens the path to $84–83.
- W1 EMA50 = 84. 80: long-term support below current levels.
See detailed scenarios in WTI (CL): price action scenarios for 09.11.2026
Key events to watch
- Tuesday, Nov 10, 13:30 GMT — U.S. core CPI for October. The main macro trigger of the week. Strong prints will bolster the probability of a December Fed hike (now about 81%), strengthen the dollar and add pressure to oil. Weak prints would support risk assets, including oil.
- Thursday, Nov 12, 15:30 GMT — EIA weekly inventory report. Prior data showed an 865k bbl draw and record low distillates; continued draws could support oil.
- Friday, Nov 13, 13:30 GMT — U.S. core PPI for October. Secondary but relevant inflation gauge.
- Geopolitical background—Trump meets Qatar's prime minister at 17:00 GMT to discuss ceasefire and nuclear talks with Iran. Any progress would weigh on oil; failure or escalation would restore the risk premium.
Conclusion and recommendations
WTI holds near $88.30 but remains below key resistances. Key level for bulls—$92.00; for bears—$86.00; and critical zone—$85.00–84.50.
For short-term traders:
- Consider long entries on a sustained break above $91.20–92.20 with targets of $93.00–94.00 and a stop-loss below $87.50.
- Consider short entries on a sustained break below $87.50 with targets of $86.20–85.00 and a stop-loss above $91.20.
- Monitor CPI (Nov 10) and the EIA report (Nov 12) closely—these are the key triggers.
For medium-term investors:
- A correction to $86.20–84.80 may be used to cautiously add long exposure if you retain a constructive view on oil, but the removal of the geopolitical premium and the uncertainty around Iran talks warrant heightened caution. Holding above $86.20 keeps the long-term bullish scenario "on the table."
Risk management:
- Expect elevated volatility around inflation prints and geopolitical news.
- Use strict stop-losses, especially on breakout trades of key levels.
- Track dollar moves, Iran negotiations, and inventory data.
This overview is based on public sources and media reports and analyses price dynamics driven by many factors; risk management and position control are essential.
Also see today's reviews:
US dollar index: price action scenarios for 09.11.2026
Dow Jones Industrial Average (DJIA): market awaits CPI, and Nvidia adds a new headache