 English

 Русский
 Bahasa Indonesia
 Bahasa Malay
 ไทย
 Español
 Deutsch
 Български
 Français
 Tiếng Việt
 中文
 বাংলা
 हिन्दी
 Čeština
 Українська
 Română



Bitcoin has once again disappointed traders who continually expect the leading cryptocurrency to rise. Last week, the market experienced another sharp decline, even though "digital gold" had shown a strong recovery immediately after the US congressional elections. This upward movement led many traders to believe that the decline had ended, only for the downward movement to resume shortly afterward.
At present, the movement is still considered corrective. However, Bitcoin is continuing to move lower with increasing consistency, despite regular upward retracements. It should be noted that the possibility of the downward trend having ended cannot be ruled out. Nevertheless, the reasons for a new bullish trend remain unclear and debatable.
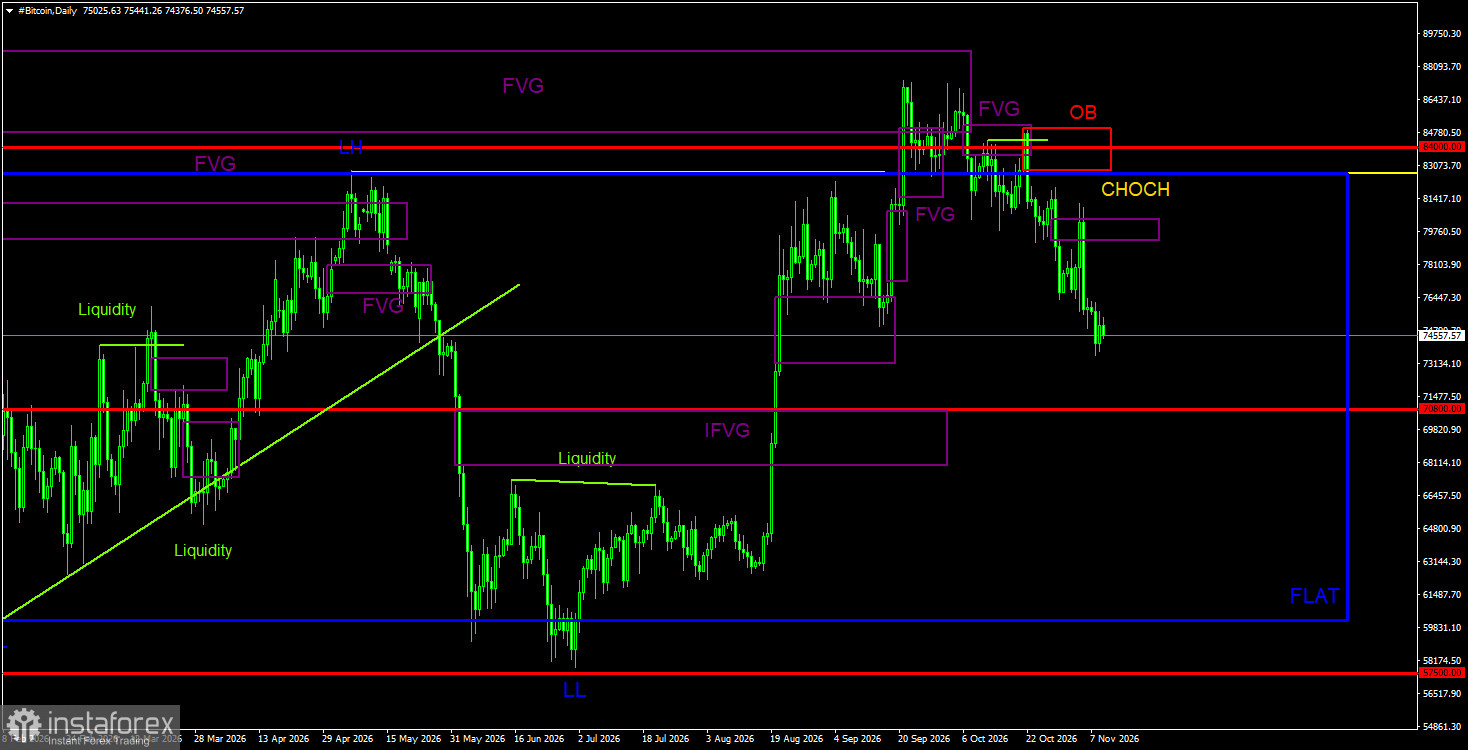
The latest Bitcoin rally, which lasted three months, was essentially a movement from the lower boundary of the sideways channel to its upper boundary on the daily timeframe. This followed the formation of a deviation below the lower boundary and subsequently a deviation above the upper boundary. The deviation above the upper boundary was substantial, but if it was indeed a deviation, Bitcoin is now moving toward the $70,800 level. "Digital gold" has returned to the sideways channel, making a move toward its 50% level a logical and technically consistent scenario.
Meanwhile, capital continues to flow out of spot Bitcoin ETFs. In addition, the latest decline in the leading cryptocurrency triggered a wave of liquidations totaling $1 billion. The question remains: why do many experts continue to discuss capital inflows into ETF instruments in 2026 when capital has been moving away from risk assets throughout the year? As previously noted, Bitcoin needs either fundamental support or sufficient demand to establish a bullish trend. However, demand is lacking.
Spot demand remains low, while futures demand more often contributes to declines in "digital gold" than to price appreciation. This is because any downward price movement triggers waves of forced position closures due to closely placed Stop Loss orders. Furthermore, considering the overall fundamental background, it is difficult to understand what factors lead many experts to expect a new all-time high (ATH) before the end of the year, while Strategy continues to purchase coins using virtually all its available funds. From this perspective, further declines remain the more likely scenario.
BTC/USD: Overall Outlook on the 1-Day Timeframe
On the daily timeframe, the bearish trend structure has been broken. Therefore, "digital gold" may have officially begun forming a new bullish trend. However, the price reached a bearish Fair Value Gap (FVG) from the previous trend and reacted to this pattern, triggering a correction.
The September move beyond the boundaries of the 60,000–82,500 sideways channels may represent a deviation. Combined with the reaction to two bearish FVGs, this could trigger a decline toward the lower boundary of the sideways channel.
This week, Bitcoin also retraced toward the nearest bearish FVG and received a clear bearish reaction, resulting in the formation of a new sell signal. Therefore, the bearish trend and sideways movement are still not considered complete.
BTC/USD: Overall Outlook on the 4-Hour Timeframe
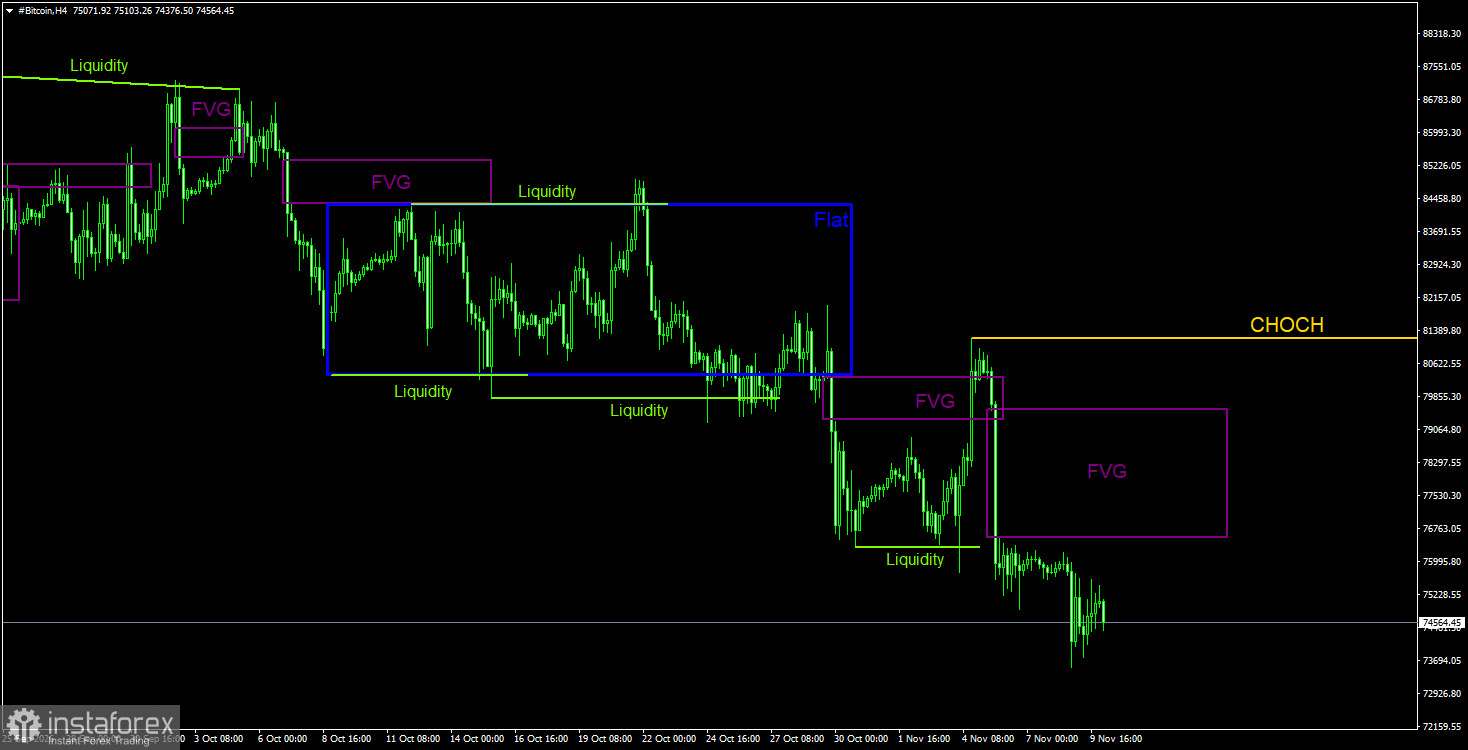
The bearish trend structure continues to develop on the 4-hour timeframe. The CHOCH line is currently located at 81,200. On the daily timeframe, all the necessary bearish reversal signals have appeared, allowing traders to open short positions.
Bitcoin's targets are currently best determined using the sideways channel on the daily chart, which remains valid from this perspective. The trend structure is bearish on the 4-hour timeframe, while Bitcoin has reacted to another bearish pattern on the daily timeframe.
The next decline followed shortly afterward. Another bearish FVG then formed, toward which the price has not yet managed to retrace. A reaction to this area could trigger another downward movement.
BTC/USD Trading Recommendations
Bitcoin attempted to establish a new upward trend, but the fundamental background, spot demand, and recent news remain too negative to support expectations of a sustained recovery.
In the near term, Bitcoin may continue to decline on the daily timeframe, as the price has already reacted to three bearish FVGs and formed a bearish Order Block (OB). The breakout beyond the boundaries of the sideways channel on the daily chart is interpreted as a deviation.
Consequently, Bitcoin has generated a bearish reversal signal and is moving toward the $70,800 level. The bearish trend is not considered complete. Short positions are currently more relevant than long positions.
Among the current technical patterns, particular attention should be paid to the bearish FVG on the daily chart, near which a sell signal was generated. A new bearish FVG has also formed on the 4-hour timeframe. A reaction to this area could provide traders with an opportunity to open additional short positions.
Explanations for the Illustrations
CHOCH (Change of Character) – A break in the existing trend structure.
Liquidity – Stop Loss orders and pending orders that market makers use to accumulate positions.
FVG (Fair Value Gap) – An area of price inefficiency. Price moves through such areas very quickly, indicating a significant imbalance between buying and selling activity. Subsequently, price tends to return to these areas and react to them in the direction of the prevailing trend.
IFVG (Inverse Fair Value Gap) – An inverted area of price inefficiency. When price returns to such an area, it does not react to it but instead breaks through it with strong momentum and subsequently retests it from the opposite side.
OB (Order Block) – A candle associated with a market maker's position opening, aimed at capturing liquidity to establish a position in the opposite direction.