 English

 Русский
 Bahasa Indonesia
 Bahasa Malay
 ไทย
 Español
 Deutsch
 Български
 Français
 Tiếng Việt
 中文
 বাংলা
 हिन्दी
 Čeština
 Українська
 Română



Trade Review of Thursday:
1H Chart of the EUR/USD Pair
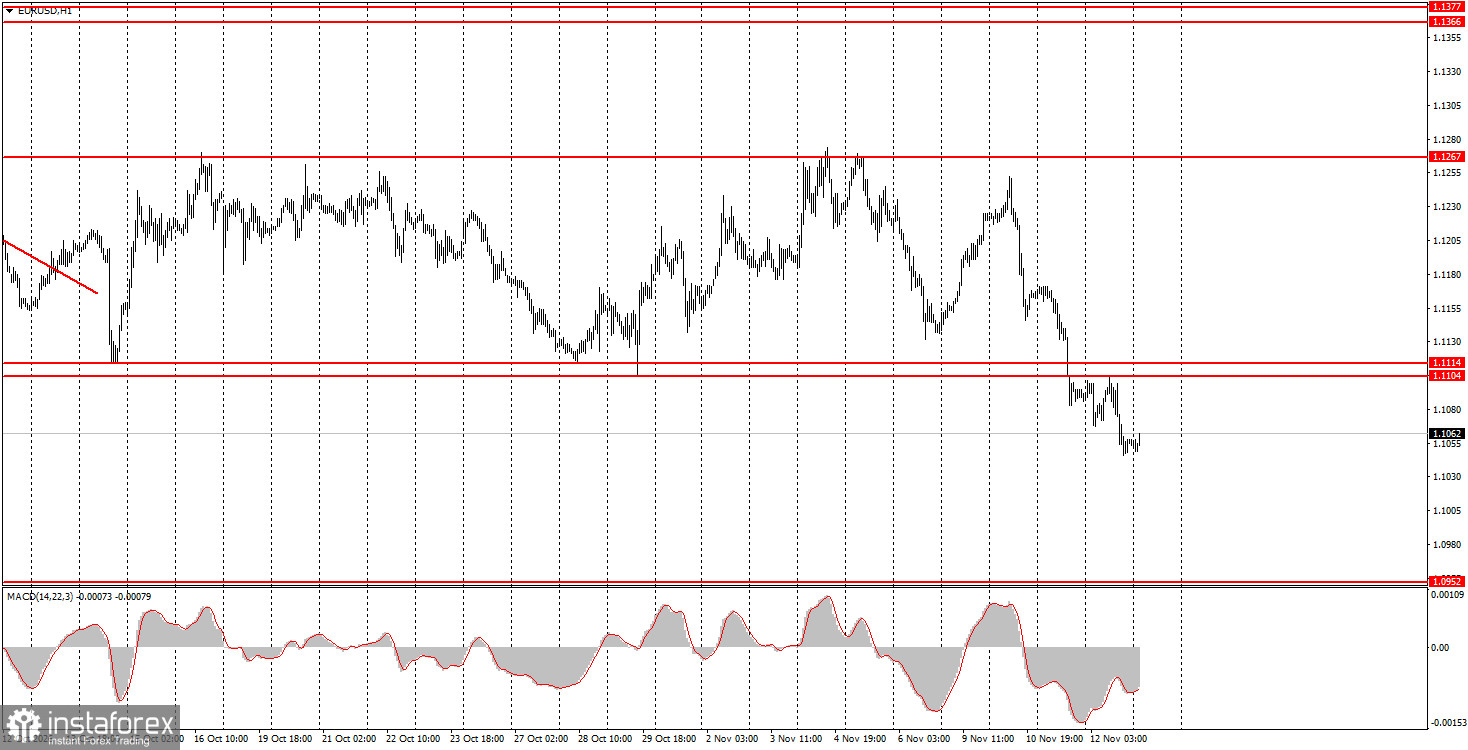
The EUR/USD pair finally left the sideways channel on Thursday after spending a month inside it. More precisely, the break of the 1.1104–1.1114 area occurred on Wednesday, and on Thursday the pair confirmed it by closing below it. Thus the flat can be officially considered over — but it ended in a way few expected. Neither Wednesday nor Thursday saw strong fundamentals to justify another drop. Yet traders have long grown accustomed to the situation where reasons are lacking, but the euro falls anyway. While on Tuesday the dollar found demand on the back of hotter-than-expected October inflation, which raised the odds of tighter Federal Reserve policy in 2026–2027, by Wednesday and Thursday that rationale had largely been priced in. Nevertheless, the euro kept falling despite similarly hawkish prospects for the European Central Bank and a gradual easing of geopolitical tensions in recent weeks.
5M Chart of the EUR/USD Pair
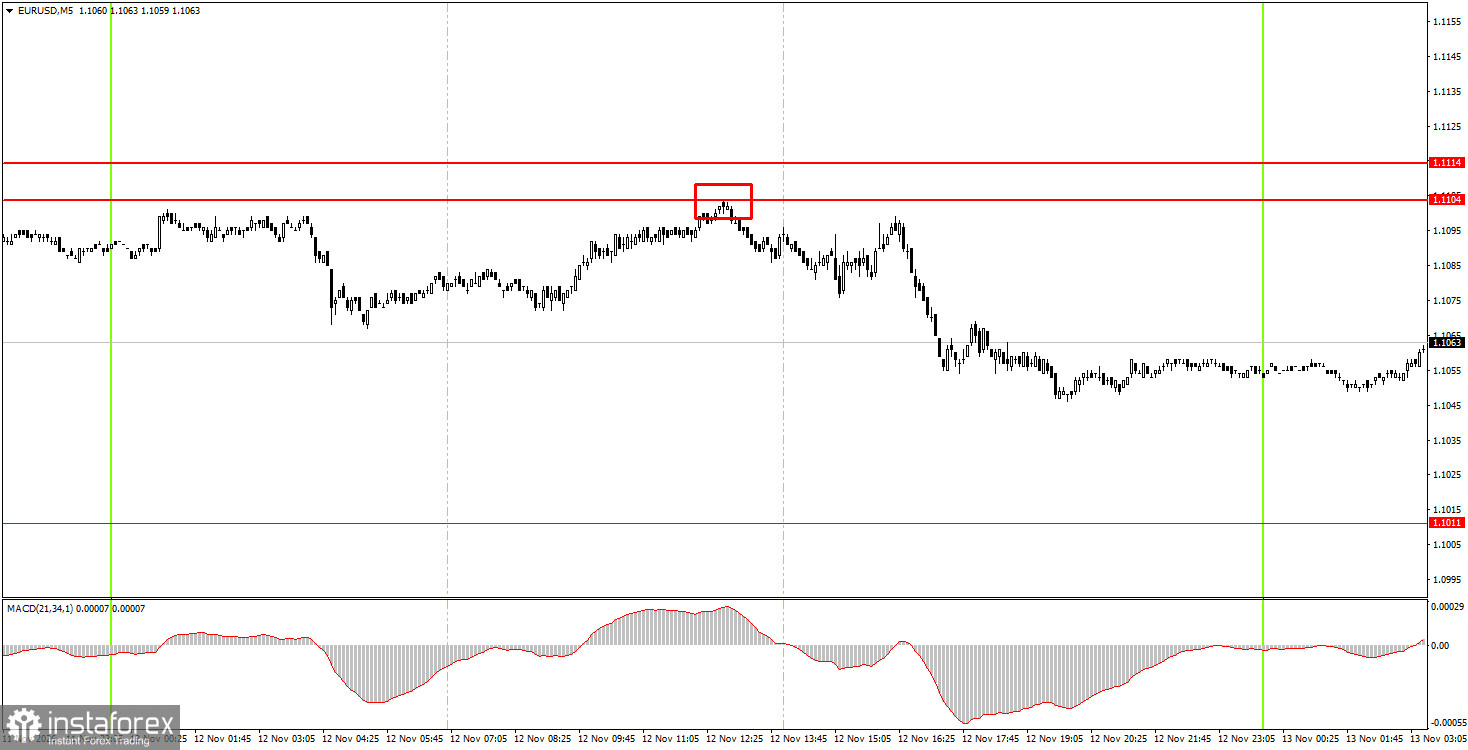
On the 5-minute timeframe, a very good sell signal formed on Thursday that traders could use. During the European session, price precisely tested the 1.1104–1.1114 area (the lower boundary of the sideways channel), allowing traders to open short positions. The pair's decline could continue today, and even on Thursday evening profit-taking would have yielded about 40 pips.
How to Trade on Friday:
On the hourly timeframe, the EUR/USD pair has resumed forming a downtrend, and the flat appears to be over. The euro has still not corrected properly in recent weeks. Given recent events, we do not believe the euro had to fall like a stone; the dollar is heavily overbought, and many euro-positive factors are being ignored. The euro has been falling for three full months with almost no correction.
On Friday, novice traders can remain in short positions after confirmation below the 1.1104–1.1114 area, targeting 1.1011. Open long positions on a decisive close above the 1.1104–1.1114 zone, targeting 1.1198–1.1218.
On the 5-minute timeframe consider the levels 1.0940–1.0952, 1.1011, 1.1104–1.1114, 1.1198–1.1218, 1.1267–1.1275, 1.1366–1.1377, 1.1461–1.1474, 1.1527–1.1531, 1.1584–1.1594. On Friday, the eurozone will publish the second estimate of Q3 GDP, and the US will release the Producer Price Index. The PPI in particular could trigger another leg higher for the dollar, since the market remains in search of catalysts to buy the US currency.
Main rules of the trading system:
- Signal strength is judged by how long the signal took to form (a bounce or a breakout). The less time required, the stronger the signal.
- If two or more false signals have been generated around a given level, all subsequent signals from that level should be ignored.
- In a flat (range), any pair can produce many false signals or none at all. Technical levels can be ignored.
- On the hourly timeframe, ideally trade MACD signals only when volatility is strong, and a trendline or trend channel confirms the trend.
- If two levels are placed very close to each other (5–20 pips), treat them as a support/resistance area.
- After a price moves 15 pips in the intended direction, move the Stop Loss to breakeven.
What is shown on the charts:
Price levels (areas) of support and resistance — levels that serve as targets when opening longs or shorts or as sources of signals.
Red lines — channels or trendlines that display the current trend and indicate the preferred trading direction.
MACD indicator (14,22,3) — histogram and signal line — an auxiliary indicator that can also be used as a source of signals.
Important speeches and reports (listed in the news calendar) can strongly affect a currency pair's movement. Therefore, when they are released, one should trade as cautiously as possible or step aside to avoid a sudden price reversal against the prior direction.
Beginner forex traders should remember that not every trade can be profitable. Developing a clear strategy and money-management rules is the key to long-term success in trading.