 English

 Русский
 Bahasa Indonesia
 Bahasa Malay
 ไทย
 Español
 Deutsch
 Български
 Français
 Tiếng Việt
 中文
 বাংলা
 हिन्दी
 Čeština
 Українська
 Română



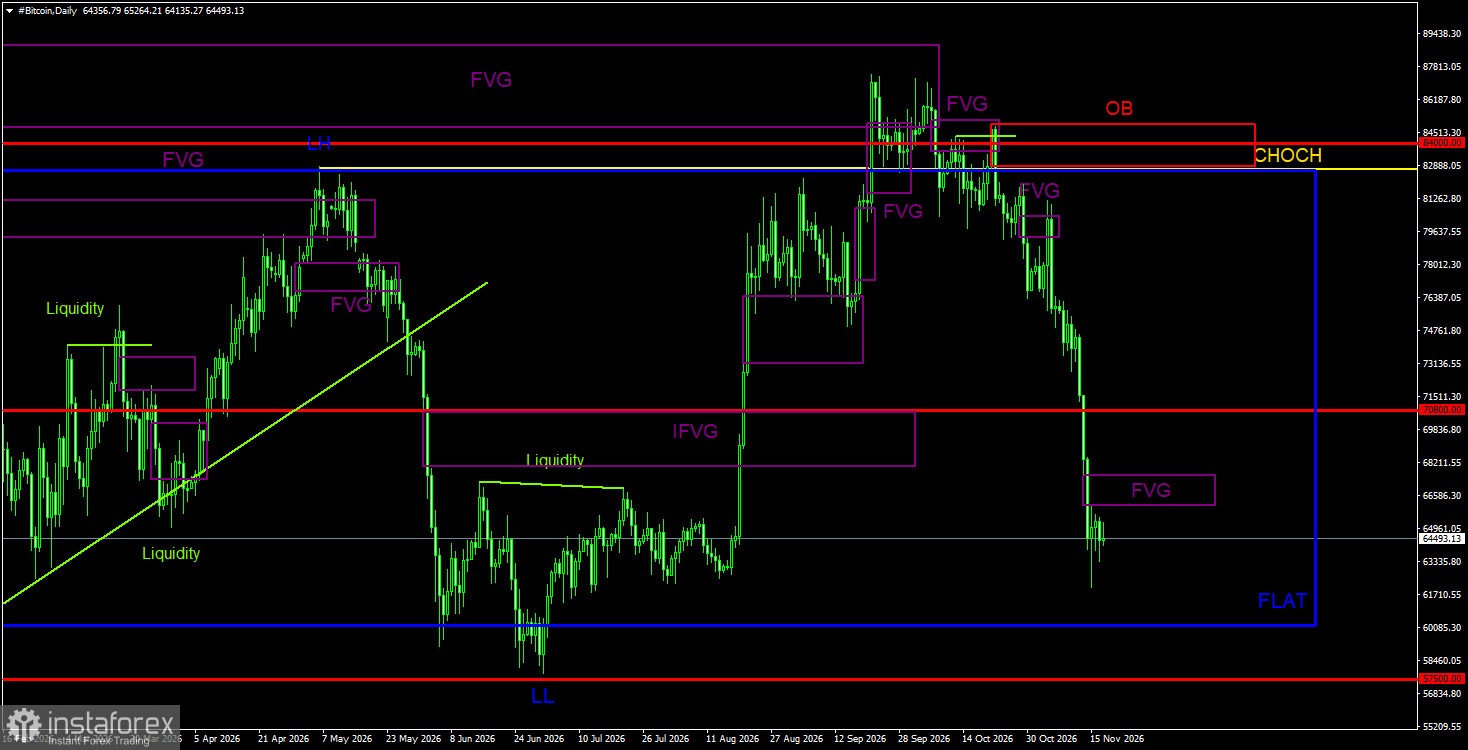
Bitcoin continues to fall and has lost about $22,000 in the current leg. Hopes for a "bull" trend are melting like mid-April snow, and experts such as Robert Kiyosaki or Michael Saylor for some reason do not comment on the current crash. We are not surprised by this development, since we have repeatedly said the downtrend cannot be considered over, and Bitcoin is still inside the daily timeframe sideways channel. As for fundamentals, we do not see a single factor at present that would support Bitcoin, cryptocurrencies, and risk assets. Thus, we continue to expect further declines and do not understand on what basis Bitcoin should suddenly begin a bull trend.
Meanwhile, analytics firm Wintermute said Bitcoin could fall to $50,000 in the near term. The firm said the bearish trend cannot be deemed finished and that the July–September recovery was temporary. A bull trend restoration is impossible without increased demand from institutions and large investors—and recall that in 2026 this category has sold Bitcoin far more often than it bought. Their forecast does not surprise us. In truth, warnings about potential falls in digital gold should have come earlier. It is already obvious to everyone that the bearish trend persists, and Bitcoin can continue to decline.
Wintermute's analysts also reported that net outflows from US ETFs since the start of the year totaled almost $2bn, while a year earlier these instruments had attracted $21bn. In addition, stablecoin supply fell by $15bn in the past month, indirectly signaling reduced demand for crypto in general and Bitcoin in particular. If investors do not want USDT and USDC, they will likely not want Bitcoin, because Bitcoin is mostly bought using stablecoins. Wintermute also noted that each new drop in digital gold triggers mass liquidations in the market—something we wrote about earlier. The entire recent Bitcoin rally was built on futures positions, which typically have tight stop-losses that are cleared at the first opportunity.
General BTC/USD picture on 1D
On the daily timeframe, Bitcoin remains inside the wide sideways channel $60,000–$82,500. Price formed a deviation of the channel's upper boundary, which, together with reactions to two bearish FVGs, provoked a powerful drop to the lower boundary of the sideways channel. On the way down, Bitcoin corrected to the nearest bearish FVG and received a clear reaction, generating a new sell signal. Last week another bearish FVG formed, but it appeared in the lower part of the channel, so the reaction to it may be weak. Recall that inside a flat all patterns are weak. Expect the crash to end only near the lower boundary of the sideways channel or around $57,500.
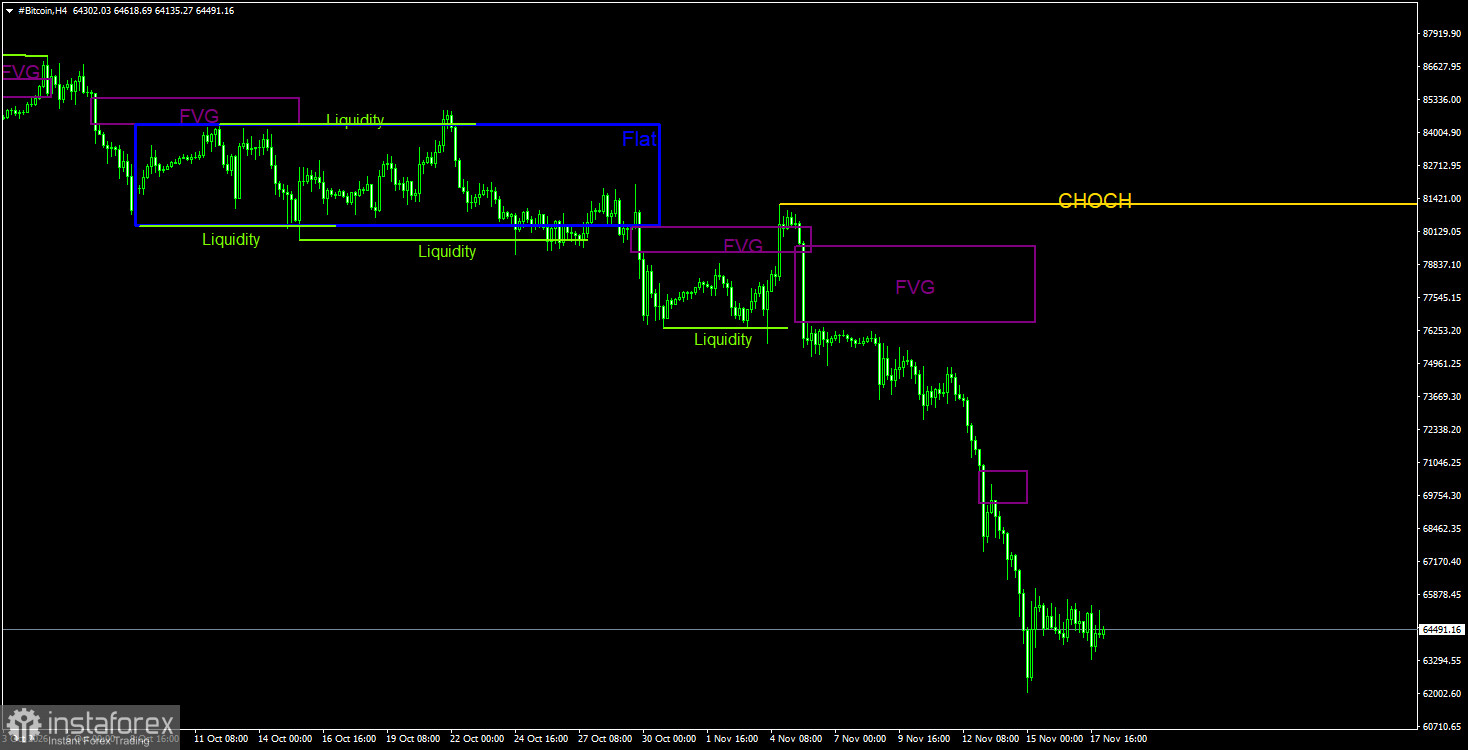
General BTC/USD picture on 4H
On the 4-hour timeframe, the formation of a bearish structure continues. The CHOCH line currently sits at $81,200. On the daily TF all necessary sell reversal signals were produced, allowing traders to open short positions in advance. Bitcoin's targets are best defined by the daily sideways channel, which, in our view, remains relevant. On the 4-hour TF, Bitcoin reacted to the latest bearish pattern. It is best to orient by the daily chart now, because the move is very strong.
Trading recommendations for BTC/USD
Bitcoin attempted to start a new uptrend in summer, but the fundamental backdrop, spot demand, and recent news proved too negative to expect continuation. In the near term, on the daily, the TF Bitcoin may remain in decline, since the price formed a deviation of the flat's upper boundary and reacted to three bearish FVGs. Therefore, a fall to the lower boundary of the sideways channel is more than plausible. Short positions remain relevant in the near term with targets at $60,200 and $57,500. The new bearish FVG on the daily chart may provide traders another opportunity to enter the market with short positions.
Illustration notes:
CHOCH—change of trend structure.
Liquidity—liquidity, stop losses, and pending orders that market makers use to build positions.
FVG—fair value gap. A price inefficiency area that price traverses quickly, indicating the absence of one side of the market; thereafter price tends to return and react to such areas in continuation of the main trend.
IFVG — inverted fair value gap. After returning to such an area, the price often does not react but impulsively breaks through and then tests from the other side.
OB — order block. The candle where a market maker opened a position aiming to take liquidity to form a position in the opposite direction.