 English

 Русский
 Bahasa Indonesia
 Bahasa Malay
 ไทย
 Español
 Deutsch
 Български
 Français
 Tiếng Việt
 中文
 বাংলা
 हिन्दी
 Čeština
 Українська
 Română



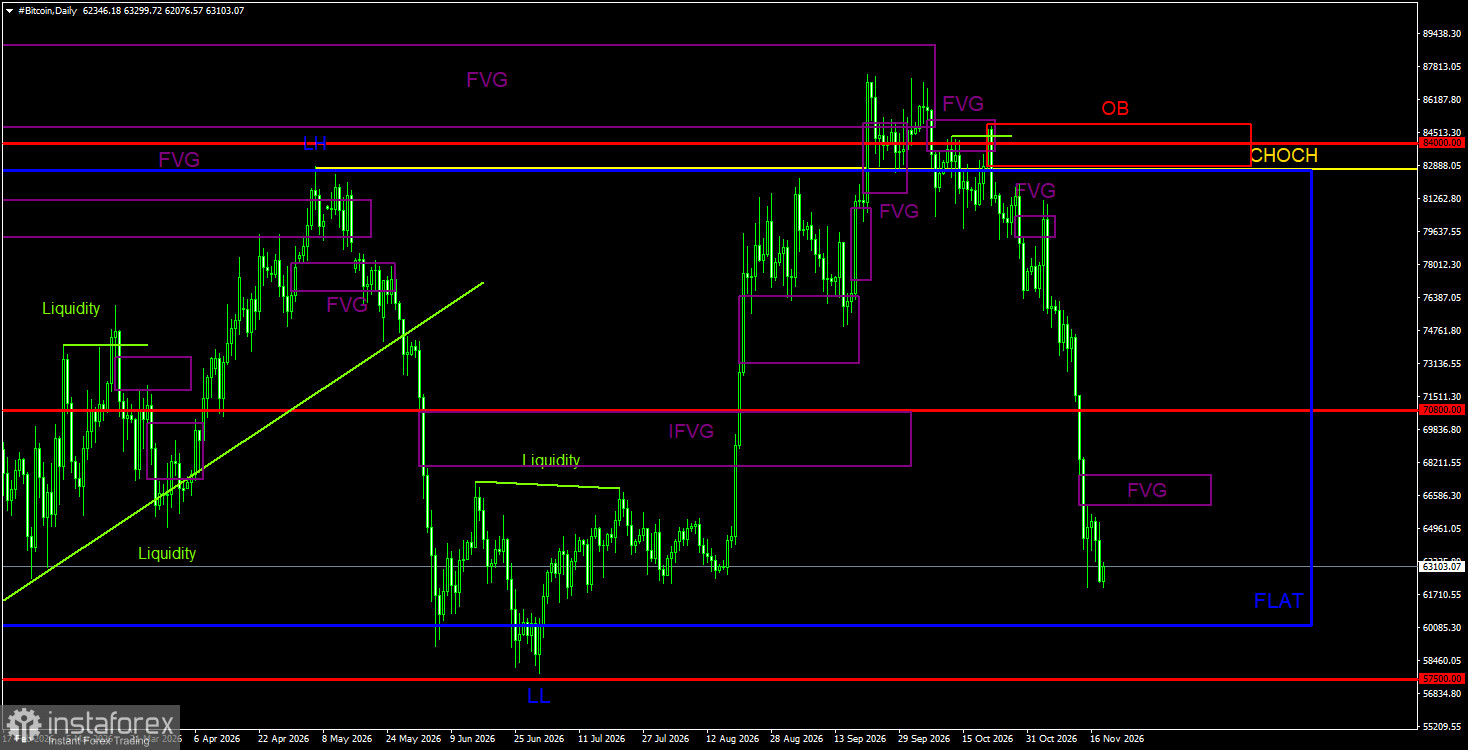
Bitcoin and Ether continue the downward move that is constantly fed by fresh negative headlines. Recall that recent events for the crypto world have been uniformly negative. Central banks—notably the Fed—continue to tighten monetary policy, the Clarity Act remains only a bill, and Democrats won the U.S. congressional elections, further reducing the odds that the Clarity Act becomes law. Two weeks ago the list of headwinds grew with the hack of the world's largest crypto exchange, Binance. That was followed by a U.S. stock market crash and a rout in tech shares, which many experts closely link to Bitcoin's price. Then U.S. inflation accelerated more than forecasts, further increasing market hawkishness on Fed policy. The cherry on top was Nvidia CEO Jensen Huang's resignation, which triggered mass capital outflows from tech giants. Then Nvidia was hit by a hacker attack demanding a large ransom. Anyone see a reason to expect a rally?
In our view, Bitcoin has a chance to rise only in two cases. First—if the price fails to break out of the sideways channel through the lower daily boundary. Second—if the Fed begins to prepare to finish the tightening cycle. However, even if the second condition occurs, a bull trend for Bitcoin is not guaranteed. Recall the simple chain "Fed cuts rates — Bitcoin rises" worked well in the past, but that does not mean it will always work. Investors now pay more attention to the AI sector, and five or ten years ago there were few yield alternatives to Bitcoin. So the Fed may cut the policy rate, but that does not automatically mean investors will rush to buy digital gold.
Meanwhile, Korean analyst Minyoel said Bitcoin may well fall to $40,000. In his view, if the U.S. stock market continues to decline, whales will keep selling Bitcoin and the dollar will keep strengthening, pushing digital gold lower. If the price drops to $40,000, more miners will leave the market, and Bitcoin's appeal to investors will fall further. 2026 could become the second consecutive year Bitcoin finishes in the red—something that has never happened before in its history. But remember: historical patterns are no more than coincidences. Bitcoin is not obliged to rally every October or every year after a halving.
Trading recommendations for BTC/USD:
Bitcoin tried to start a new uptrend in summer, but the fundamental backdrop, spot demand, and recent news proved too negative to expect continuation. In the near term on the daily timeframe, Bitcoin may remain in decline, since price formed a deviation of the flat's upper boundary and reacted to three bearish FVGs. Therefore, a fall to the lower boundary of the sideways channel is more than plausible. Short positions remain relevant in the near term with targets at $60,200 and $57,500. The new bearish FVG on the daily chart may offer traders another opportunity to enter the market with short positions. Around $60,200 and $57,500, a reversal up is possible, but talk of the start of a bull trend is premature.
Trading recommendations for ETH/USD:
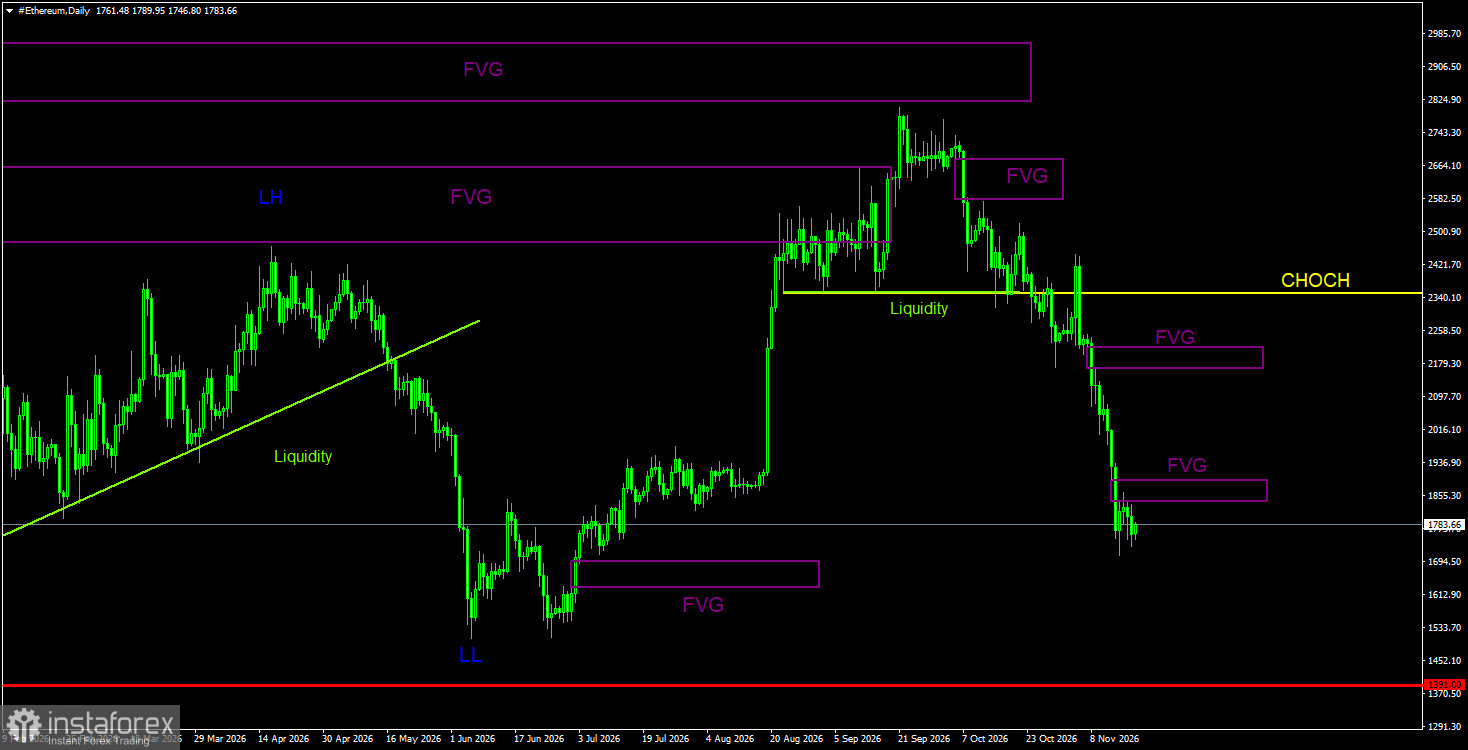
On the daily TF, the technical picture for Ether changed. Ether made a significant upward impulse in June–September 2026 that could mark the start of a new long-term trend. However, there are no signs that Bitcoin's bear market has ended. Bitcoin formed enough sell signals and bearish patterns on the daily chart to produce the recent declines. Therefore, it is unsurprising Ether also plunged and may continue south. The target is near $1,391. On the daily and 4-hour TF there are multiple bearish FVGs that serve as POIs for short positions. Expect Ether's decline to end only if Bitcoin fails to breach the daily sideways channel's lower boundary.
Illustration notes:
CHOCH—change of trend structure.
Liquidity—liquidity, stop losses, and pending orders market makers use to build positions.
FVG—fair value gap. A price inefficiency area that price traverses quickly, indicating the absence of one side of the market; thereafter price tends to return and react to such areas in continuation of the main trend.
IFVG — inverted fair value gap. After returning to such an area, the price often does not react but impulsively breaks through and then tests from the other side.
OB — order block. The candle where a market maker opened a position aiming to take liquidity to form a position in the opposite direction.