 English
  Русский
 Bahasa Indonesia
 Bahasa Malay
 ไทย
ไทย Español
 Deutsch
 Български
 Français
 Tiếng Việt
 中文
中文 বাংলা
বাংলা हिन्दी
 Čeština
 Українська
 Română

The index ended the year below the negative territory, as it found support around 101.97, where a key demand area is located across the board. However, current moves should be taken as corrective ones, because the overall structure remains pointing to the upside and further gains are expected following New Year Eve's holidays. Next resistance lies at the 102.53 level and MACD indicator is favoring that scenario.
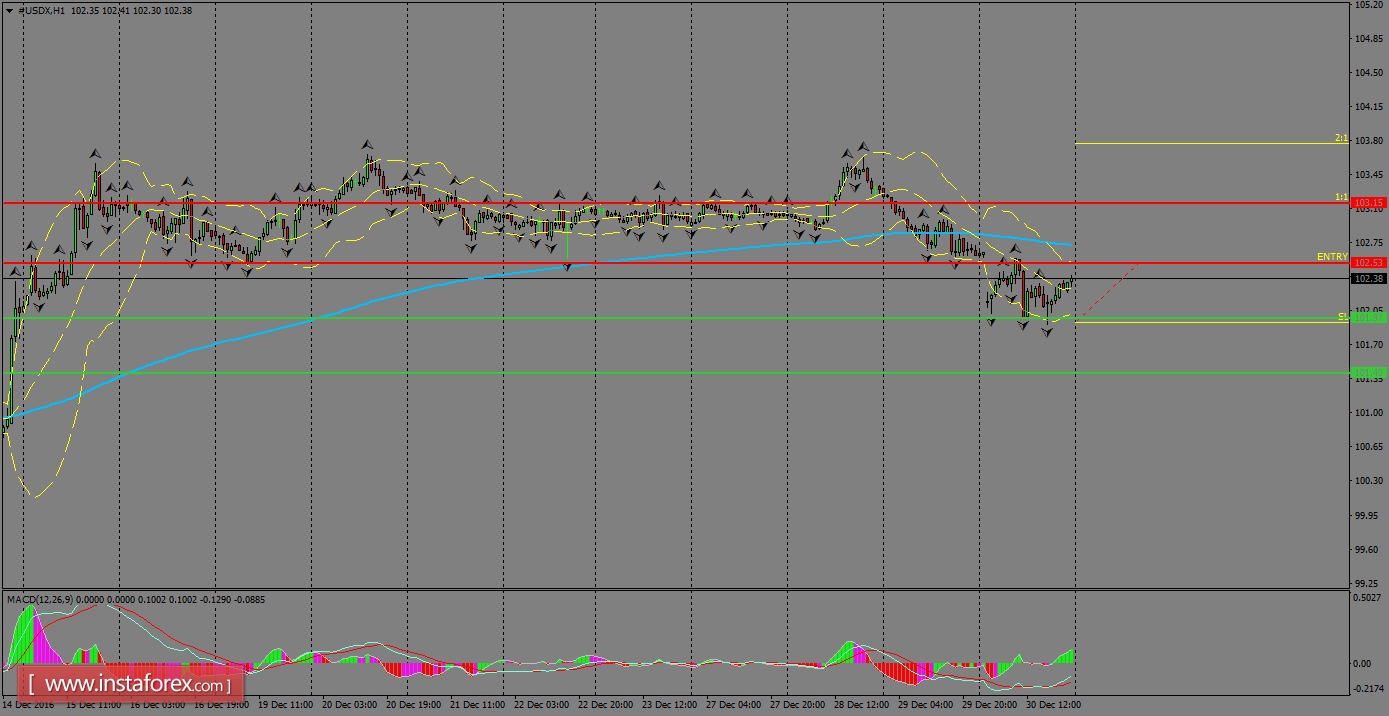
H1 chart's resistance levels: 102.53 / 103.15
H1 chart's support levels: 101.97 / 101.40
Trading recommendations for today: Based on the H1 chart, place buy (long) orders only if the USD Index breaks with a bullish candlestick; the resistance level is at 102.53, take profit is at 103.15 and stop loss is at 101.92.