 English
  Русский
 Bahasa Indonesia
 Bahasa Malay
 ไทย
ไทย Español
 Deutsch
 Български
 Français
 Tiếng Việt
 中文
中文 বাংলা
বাংলা हिन्दी
 Čeština
 Українська
 Română

The index gained bullish momentum following strong US data posted during Tuesday's session and it managed to make a new 14 years high across the board. However, USDX was capped by the 103.81 level, where a pullback took place and sent the index to test the support zone of 103.15. If it does a breakout below that area, then we can expect a decline towards 102.82.
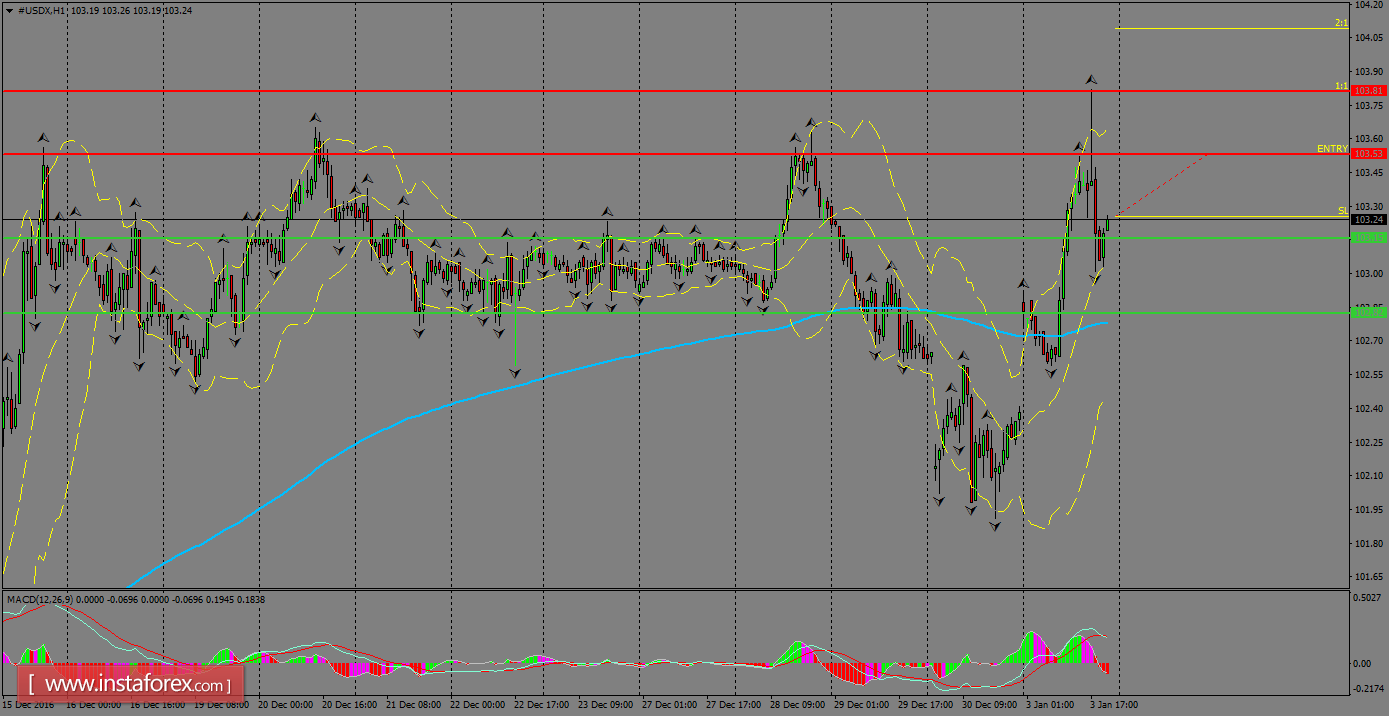
H1 chart's resistance levels: 103.53 / 103.81
H1 chart's support levels: 103.15 / 102.82
Trading recommendations for today: Based on the H1 chart, place buy (long) orders only if the USD Index breaks with a bullish candlestick; the resistance level is at 103.53, take profit is at 103.81 and stop loss is at 103.25.