 English
  Русский
 Bahasa Indonesia
 Bahasa Malay
 ไทย
ไทย Español
 Deutsch
 Български
 Français
 Tiếng Việt
 中文
中文 বাংলা
বাংলা हिन्दी
 Čeština
 Українська
 Română

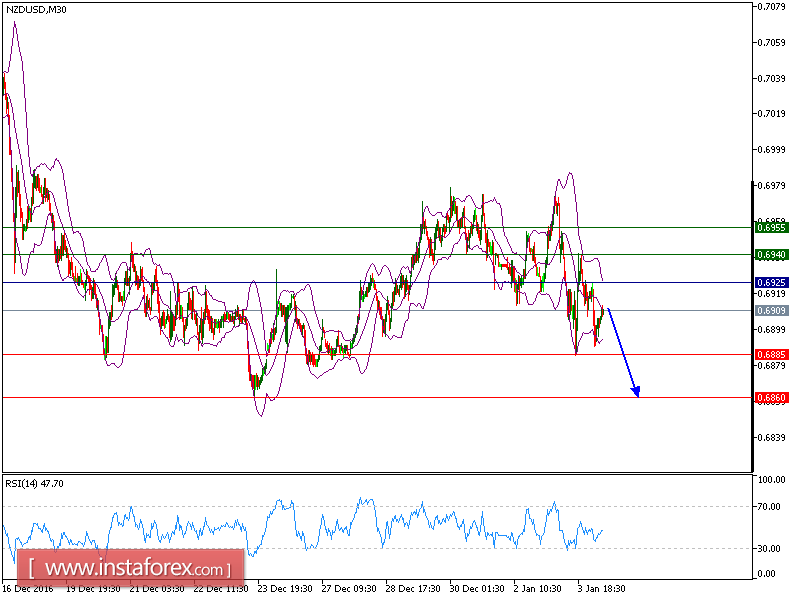
NZD/USD is expected to trade with a bearish bias. The pair is trading below its resistance, representing an intraday horizontal level. Both the 20-period and 50-period moving averages are heading downward and calling for further downside. In addition, the relative strength index is mixed to positive above its neutrality area at 50. Therefore, as long as 0.6925 is not broken, look for a new rebound to 0.6885 and 0.6860 in extension.
The pair is trading below its pivot point. It is likely to trade in a lower range as long as it remains below the pivot point. Short positions are recommended with the first target at 0.6885. A break below this target will move the pair further downwards to 0.6860. The pivot point stands at 0.6925. If the price moves in the opposite direction and bounces back from the support level, it will move above its pivot point. It is likely to move further to the upside. According to that scenario, long positions are recommended with the first target at 0.6940 and the second one at 0.6955.
Resistance levels: 0.6940, 0.6955, 0.6975
Support levels: 0.6885, 0.6860, 0.6835