 English
  Русский
 Bahasa Indonesia
 Bahasa Malay
 ไทย
ไทย Español
 Deutsch
 Български
 Français
 Tiếng Việt
 中文
中文 বাংলা
বাংলা हिन्दी
 Čeština
 Українська
 Română

Gold price remains strong in the short-term chart as price is making higher highs and higher lows. Short-term trend has already changed to bullish and yesterday we saw a backtest of support and an upward reversal. This is a bullish sign. Minimum short-term upside target for Gold is at $1,180-$1,200.
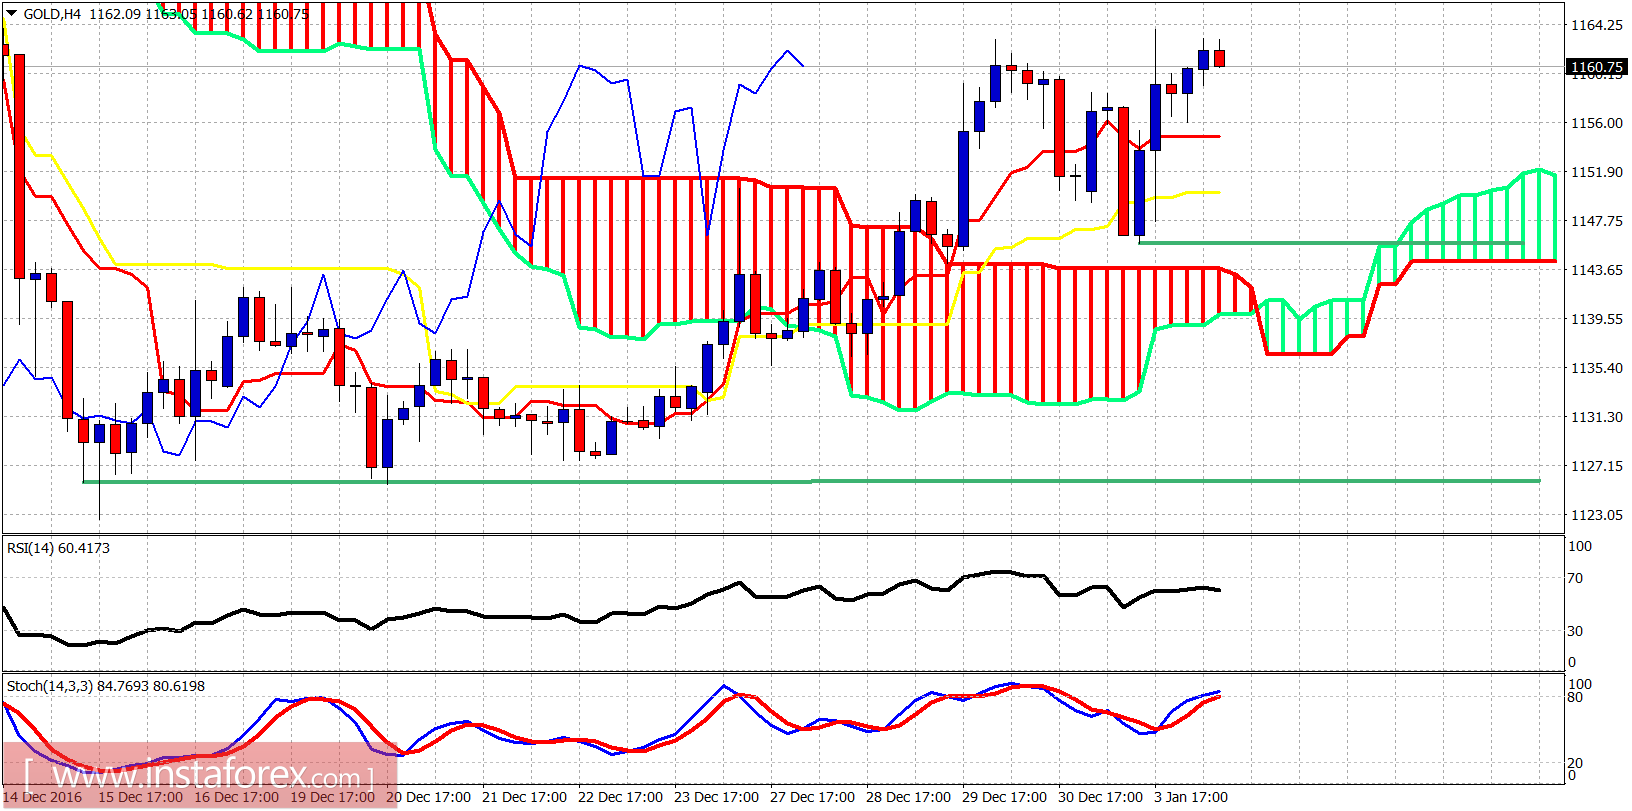
Green lines - support
Short-term support is at $1,144 and next at $1,126. Yesterday, price backtested cloud support as expected. Gold price has made a short-term important low at $1,126 and this could turn out to be a long-term important low as the $1,045 low in 2015 was.
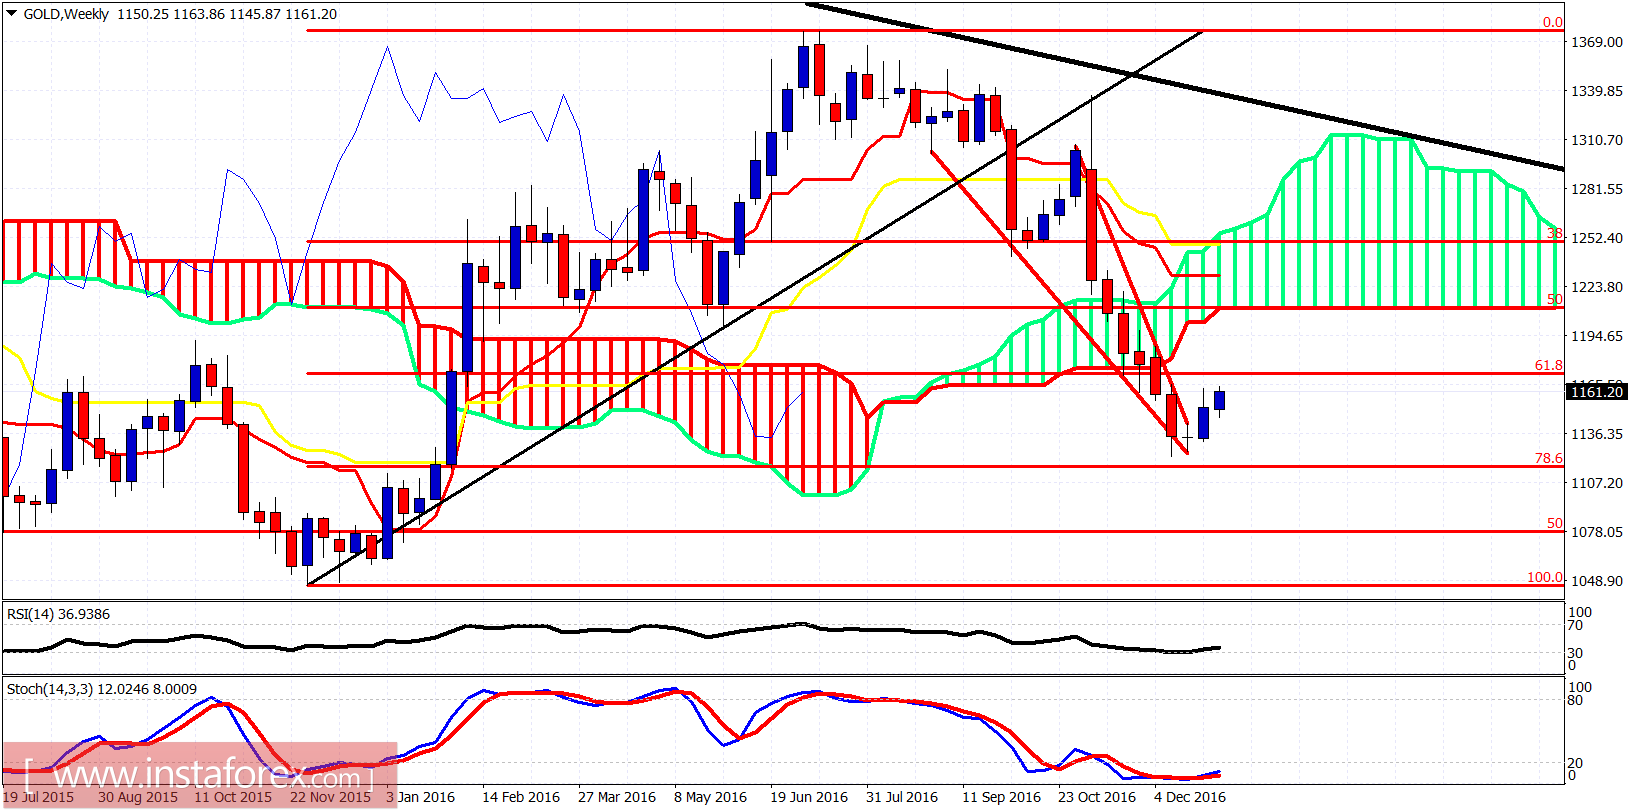
Gold price has given a weekly bullish reversal signal as price has broken out of the wedge to the upside. Oscillators are oversold, diverging and turning upwards. Strong weekly resistance is found at the lower cloud boundary at $1,200-$1,220 area. Bulls need to clear above that area in order to confirm that $1,122 is an important long-term low.